FEP Manual
1. RBFE Submission
The RBFE Submission interface manages job submission for FEP calculations, which includes the following functions: uploading protein and protein paration (in the Protein function), uploading ligand and ligand preparation (in the Ligands function), constructing the peturbation graph and generating molecule pairs (in the Pairs function), and setting task parameters
1.1 Protein
This interface contains necessary processes for setting up the protein for the FEP calculations, including protein upload, protein structure processing, build membrane protein, and protein force field parameter settings.
| Window | Window Display | Parameters | Description | Notes |
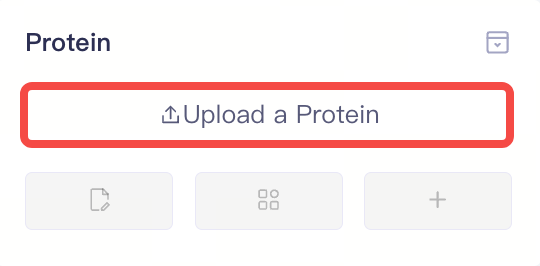
| Protein |
| Upload a Protein | Upload a local protein file | 1)Supports uploading .pbd and .mae format files from local, but does not support uploading membrance-bond protein files. 2)The protein preparation window will pop up automatically after uploading the protein. 3) Support non-standard amino acids: TPO, SEP, SEQ, HYP, ORN, DAB. |
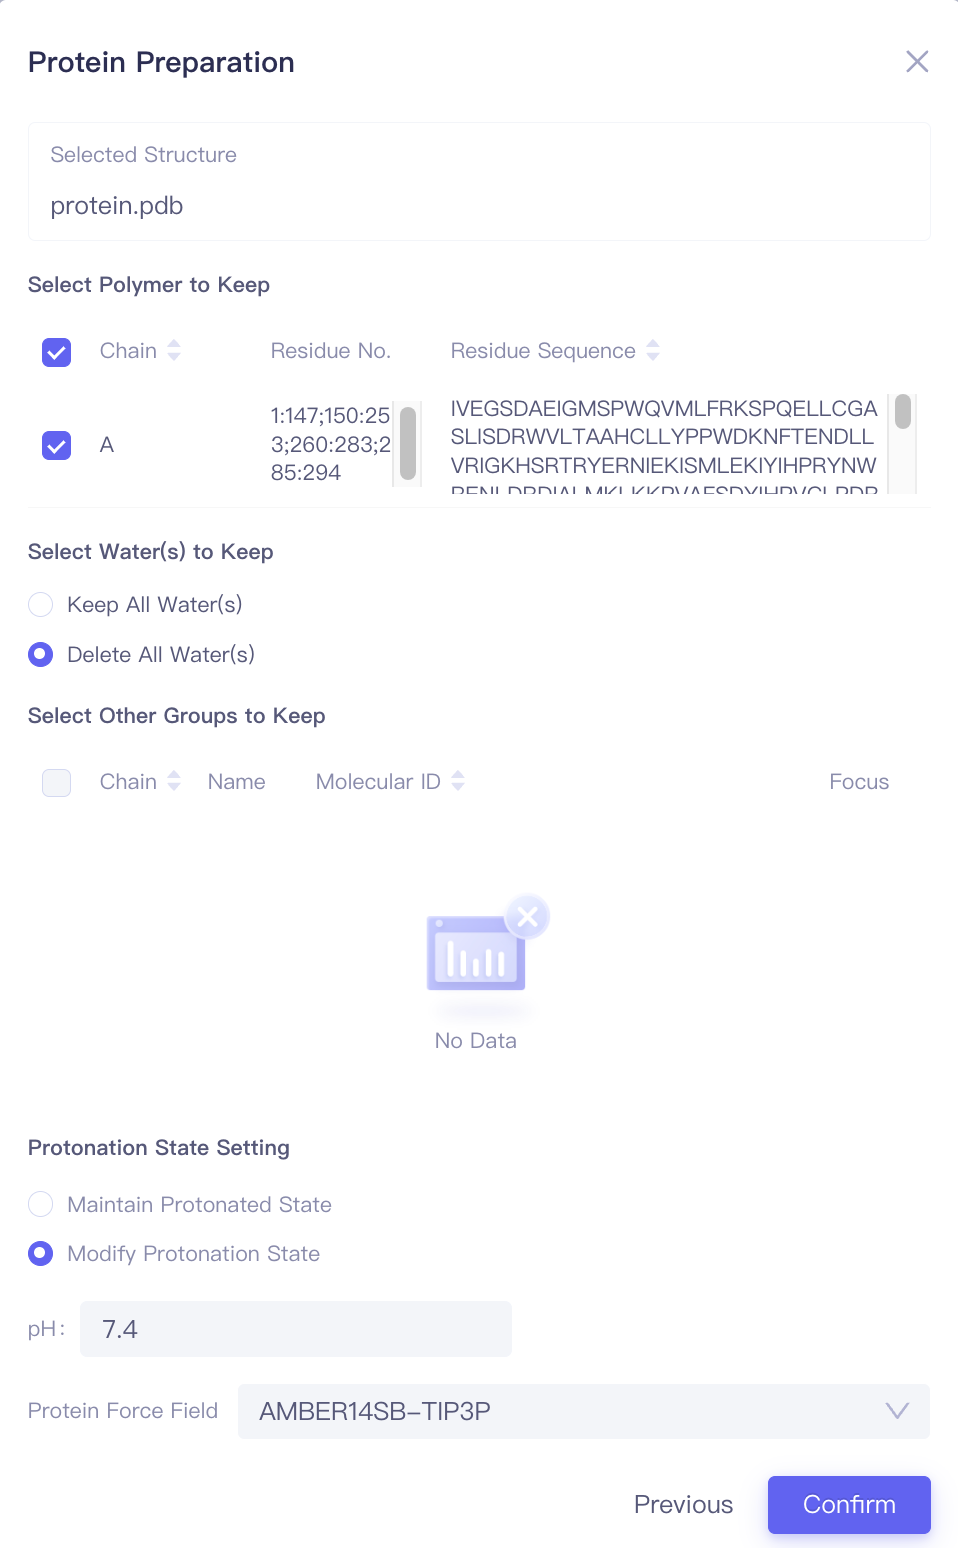
| Protein Preparation |
| Select Polymers to Keep | Select the amino acid chain to retain | |
| Select Water(s) to Keep | Select water molecules to retain | |||
| Select Other Groups to Keep | Select other molecules or functional groups to keep | Includes cofactors and covalent substitution groups | ||
| Protonation State Setting | Set the parameters for determining amino acid side chains | Maintain protonated state: Retain the protonation state of the input. Modify protonated state: Adjust the protonation state based on the pH settings below. | ||
| Protein Force Field | Select protein forcefield | Supports AMBER14SB-TIP3P and AMBER99SB-STAR-ILDN-MUT-TIP3P | ||
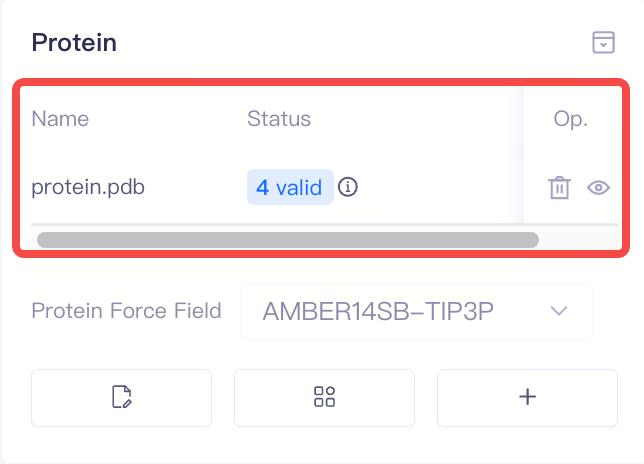
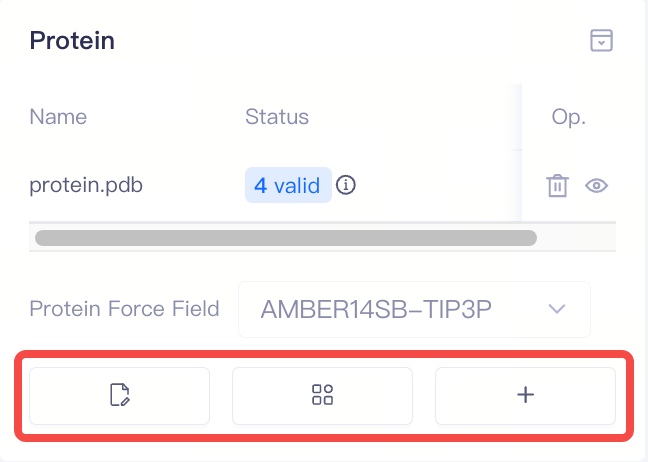
| Protein |
| Proteins | Display protein information | 1)After protein preparation, the system automatically performs a protein validation check, which returns one of three statuses: Valid, Error, or Warning. You can access the Protein Reliability Report by clicking the icon next to the protein status. 2)In the protein list, the Delete and Show/Hide buttons under Op.(Operation) allow you to delete or show/hide proteins. 3)If the protein validation check fails (Error), you can delete the protein and re-upload it. |
| Modify Protonation States | Modify the protonation state of a specific amino acid side chain | If the protein validation check results show a protonation state warning, or if there are important protonatable amino acids near the protein-ligand binding site, you can manually adjust the amino acid protonation states here. | |
| Add Non-standard Component | Add Non-standard Component | If there are non-standard components (such as co-factors or metal ions) near the protein binding site, you can upload relevant files to ensure the accuracy of the simulation. | ||
| Build Membrane | Build membrane structures | If the target protein is a membrane protein, you can build the membrane-bound protein structure here | ||
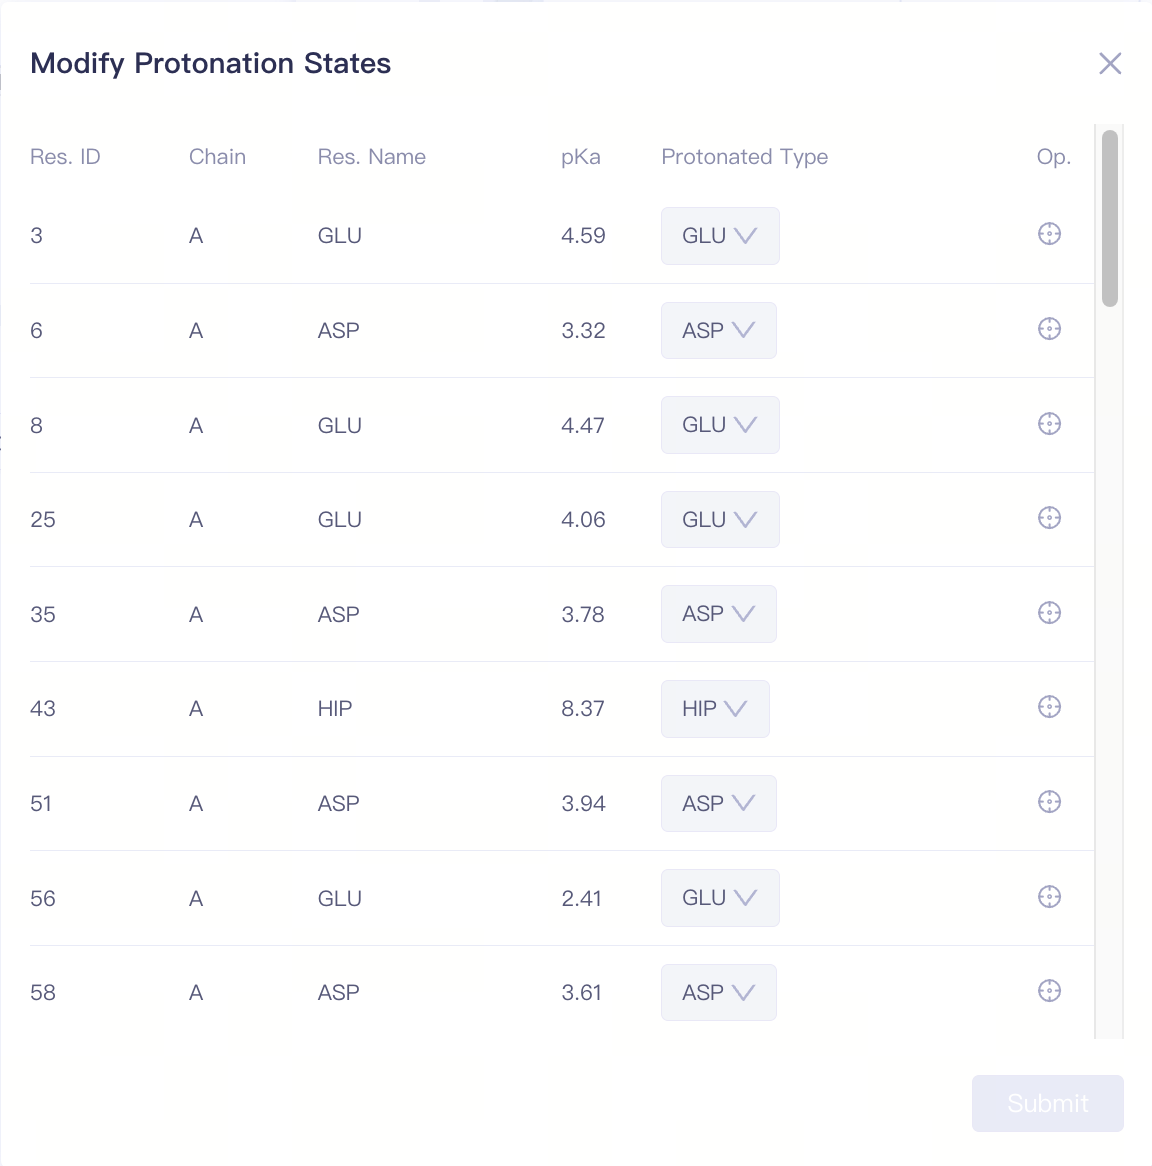
| Modify Protonation States |
| Protonated Type | Protonation state of the amino acid | Supports modification of the side chain protonation states for HIS/ASP/GLU/LYS/CYS. Click "Submit" to confirm the changes. |
| Focus | Focus on a specific amino acid | Click this button to center and highlight the corresponding amino acid in the 3D Viewer window. | ||
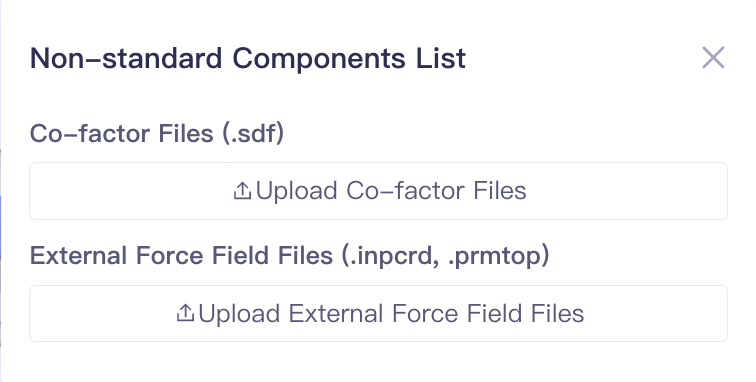
| Add Non-standard Component |
| Upload Co-factor Files | Upload structure files for co-factors. | Supports uploading relevant non-standard component structures or pre-built force field parameter files. Note: Each uploaded structure file and force field file will be included in the final calculation. Please carefully check that the uploaded components are correct, and ensure that the structure and force field files correspond to desired components. |
| Upload External Force Field Files | Upload external force field files | |||
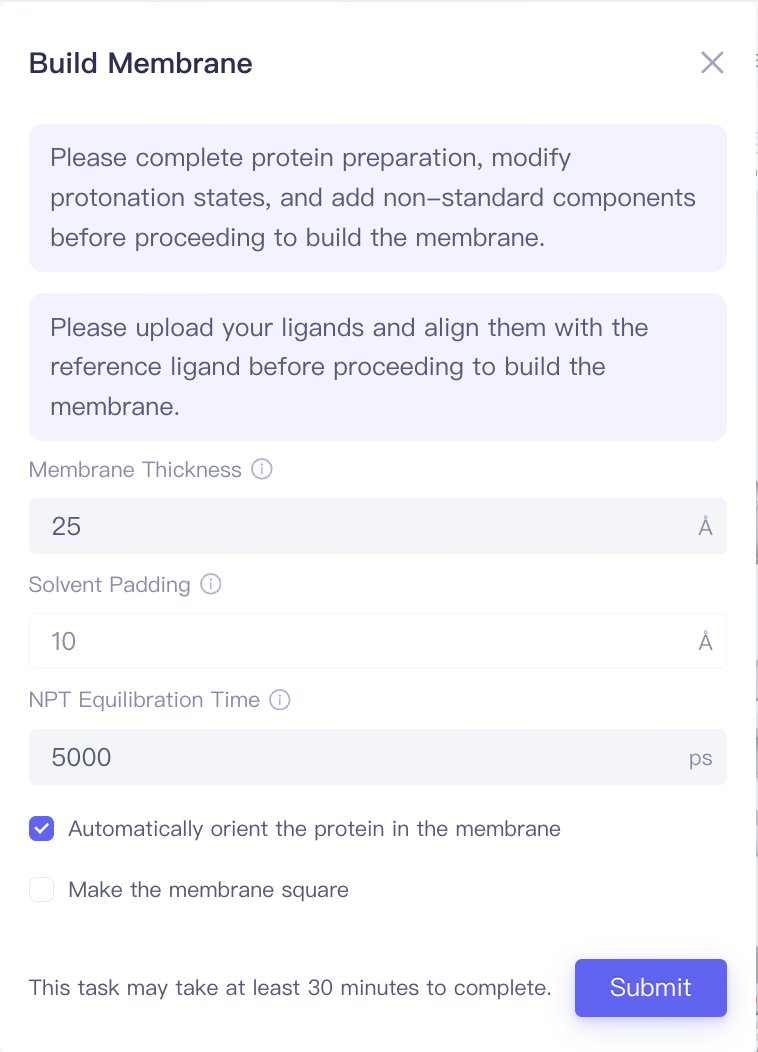
| Build Membrane |
| Membrane Thickness | Membrance Thickness | Note: Before building the membrane, the protein preparation, modify protonation states, and the add non-standard components steps must be completed. Additionally, the ligand upload and the ligand alignment steps should be finished. |
| Solvent Padding | Solvent Padding | |||
| NPT Equilibration Time | NPT Equilibration Time | |||
| Automatically orient the protein in the membrane | Automatically orient the protein in the membrane | |||
| Make the membrane square | Make the membrane square |
1.2 Ligands
This interface includes necessary steps to set up ligands for the FEP calculation, including ligand upload, force field settings, ligand alignment, and uploading affinity data.
| Window | Window Display | Parameters | Description | Notes |
| Ligands |
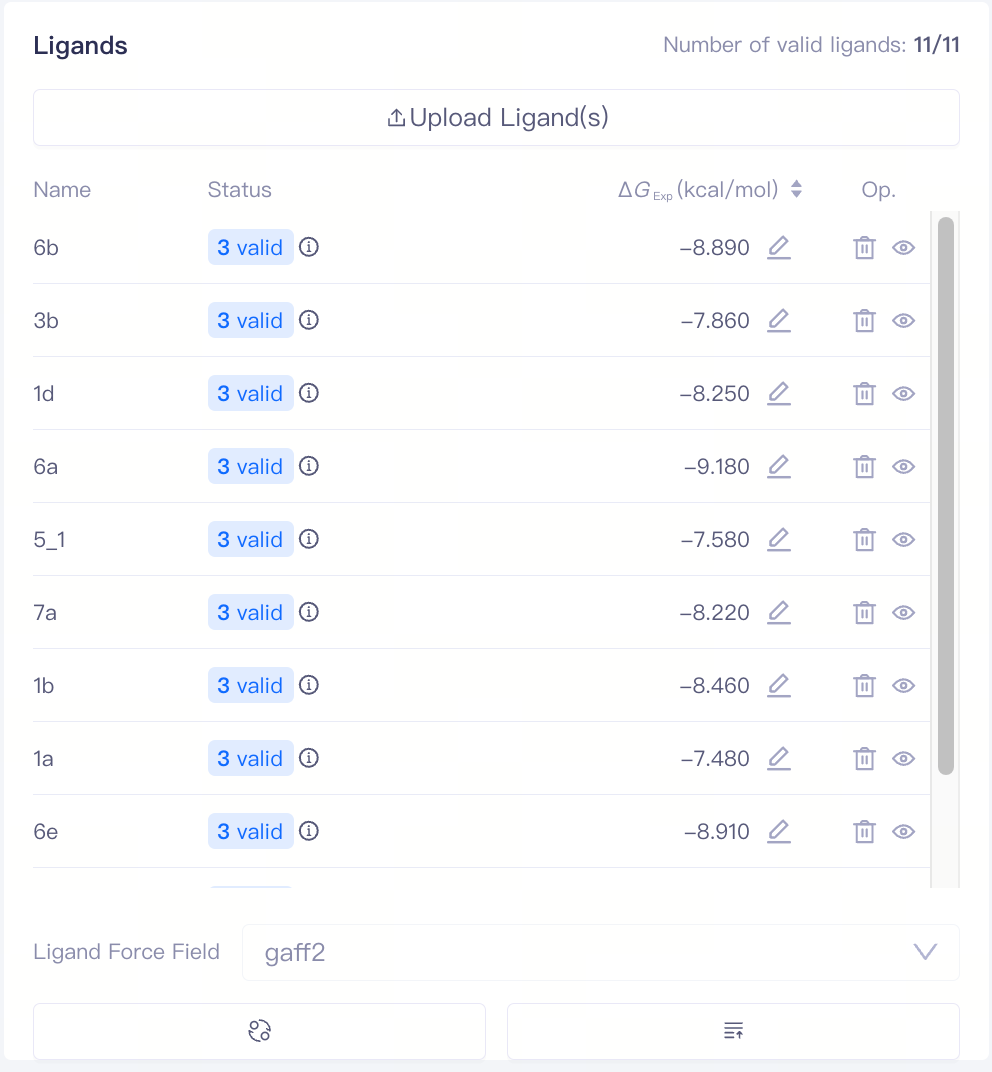
| Upload Ligand(s) | Upload Ligand(s) | Upload local ligand files in .sdf format. Experimental IC₅₀ values and ΔG values are supported |
| Ligands | Uploaded ligands will enter the ligands list | After uploading ligands, the system automatically performs a ligand validation check, which returns one of three statuses: Valid, Error, or Warning. You can access the Ligand Reliability Report by clicking the icon next to the ligand status. | ||
| Ligand Force Field | Ligand forcefield | Supports gaff2 | ||
| Auto Finetune Ligand Force Field | Auto Finetune ligand force field based on the DPA2 pretraining model | Time consuming | ||
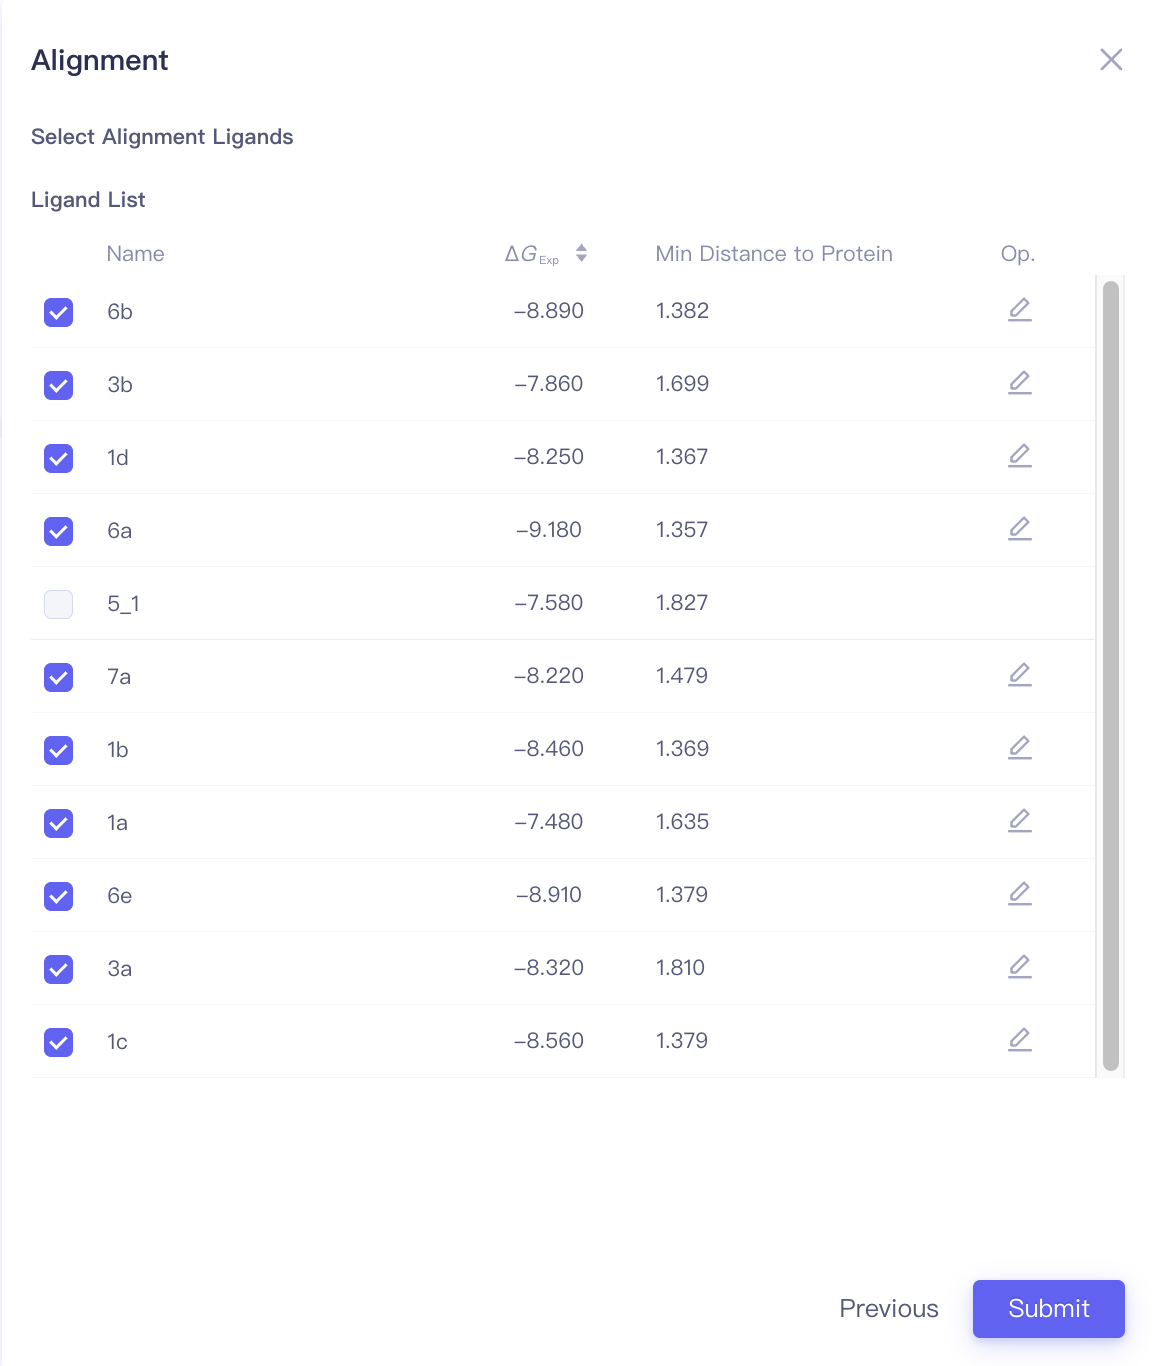
| Align Ligands | Align ligands | |||
| Upload Affinity Data | Upload Affinity Data | |||
| Align Ligands |
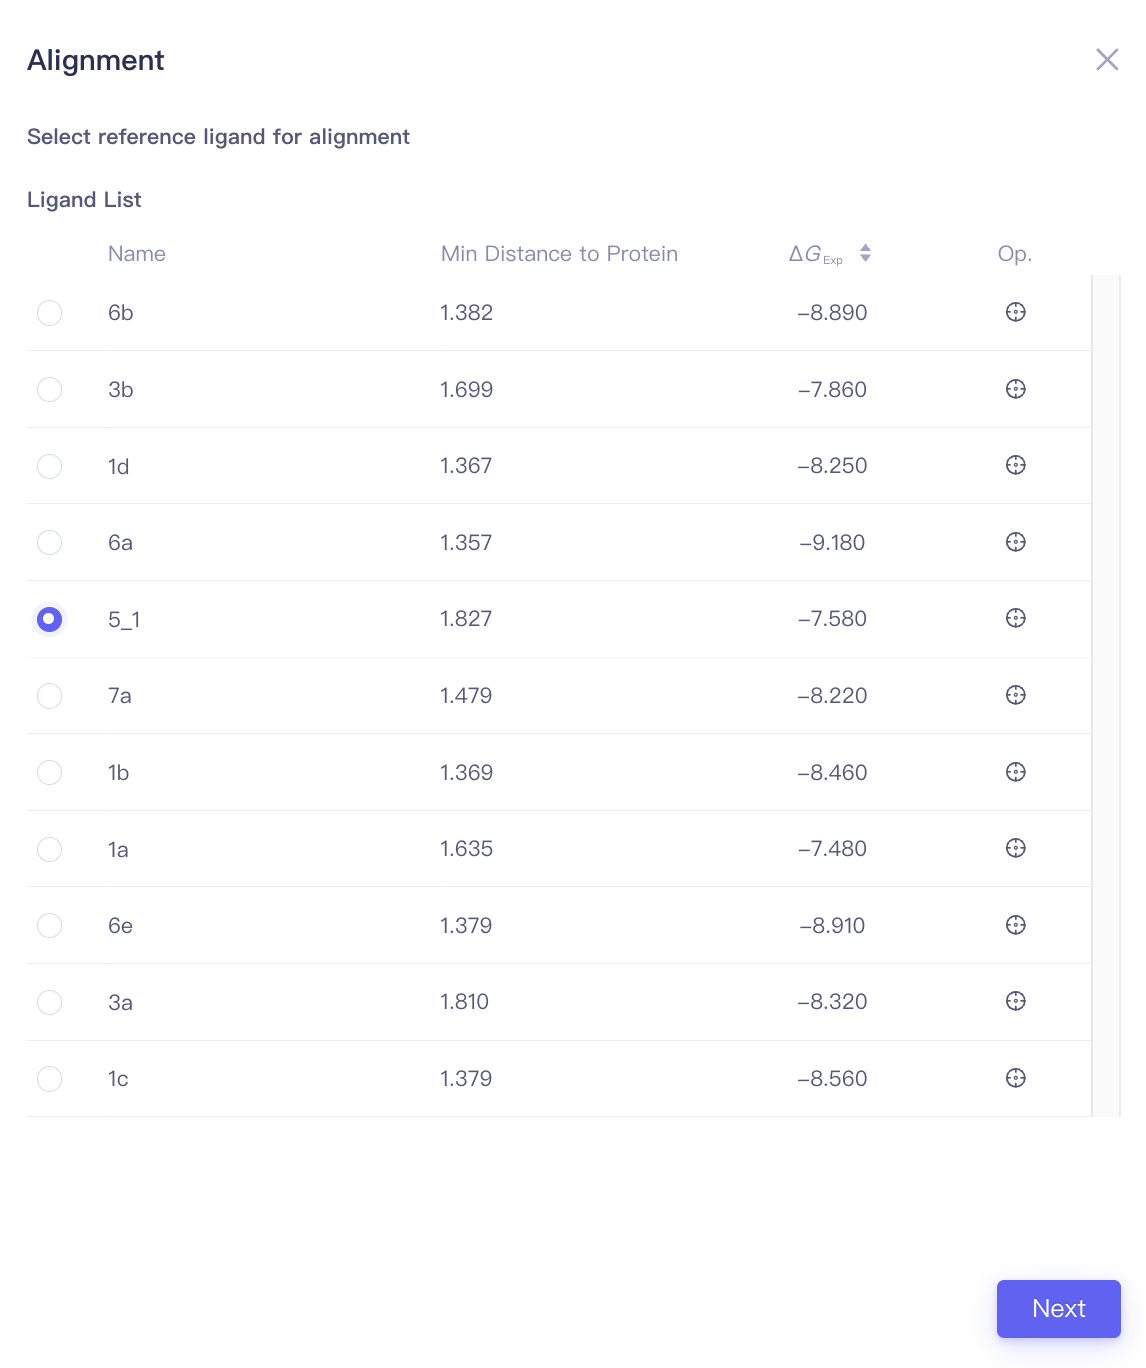
| Min Distance to Protein | Minimal distance between the ligand and the protein | When performing ligand alignments, one must ensure that the reference ligand is within the protein pocket. The distance between the ligand and the protein can be used to determine whether the ligand should be selected as the reference ligand. |
| Focus | Focus | Click this button to center and highlight the corresponding ligand in the 3D Viewer window. | ||
| Atom Mapping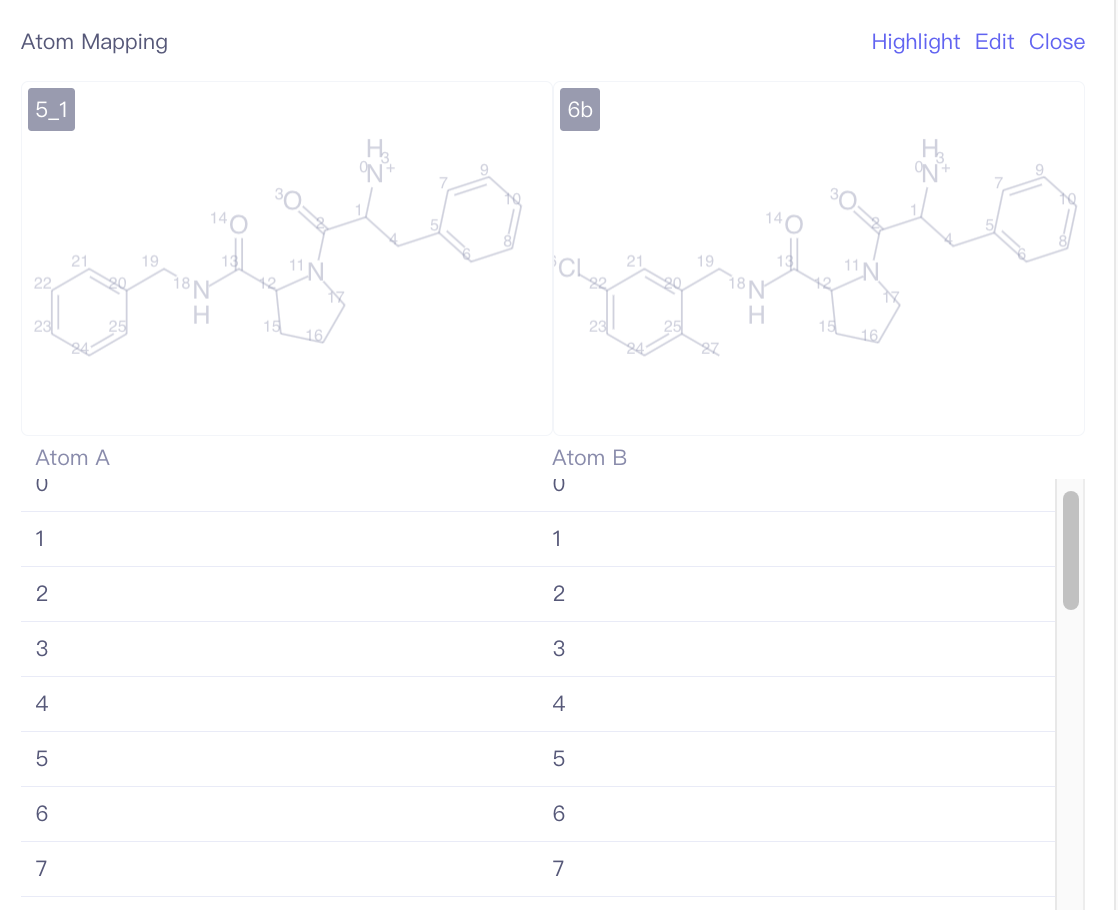 | Edit the atom mapping between the ligand to be aligned and the reference ligand. | During ligand alignment, the program will use the default MCS constrained docking method to align the ligands. This may result in the same functional groups within the molecule pair not aligning together, especially when macrocycle structures are involved. If you know the common structural regions of the ligands and want to avoid misalignment due to alignment offsets, you can specify the common structural regions through atom mapping before performing the alignment calculation. | |
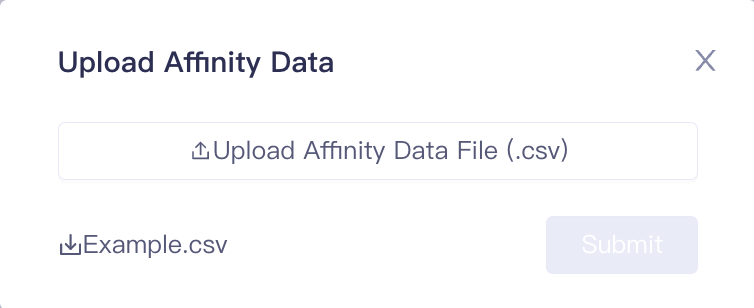
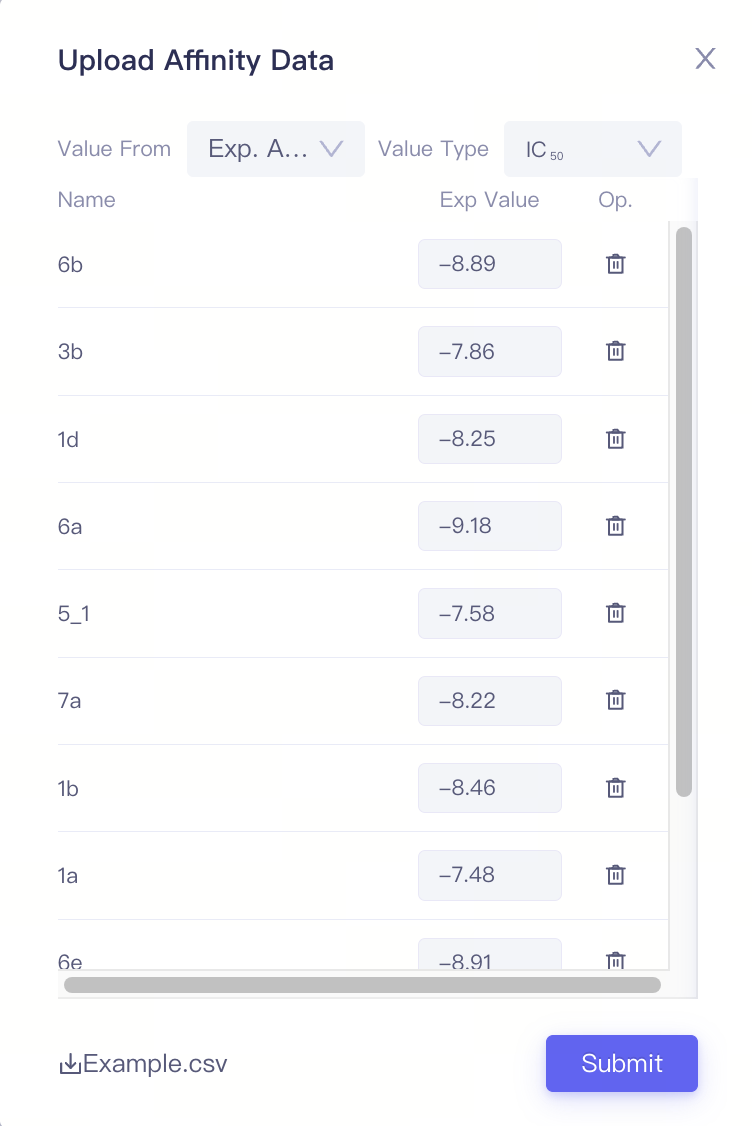
| Upload Affinity Data |
| Upload Affinity Data File (.csv) | Upload affinity data from local files | When the ligand molecules have measured experimental activity data (such as IC₅₀ or Ki values), you can batch upload the corresponding experimental values using the Upload Affinity Data File (.csv). |
| Value Type | Support IC₅₀ / ΔG | 1)The ligand name must match the name of the ligands uploaded previously. 2)When uploading activity/affinity values via data files, you need to select the value type in the Value Type field. Based on this selection, the values will be converted into ΔG and recorded in the ligand list. 3)The unit of IC₅₀ is nM, the unit of ΔG is kcal/mol |
1.3 Pairs
This interface includes necessary steps to construct the perturbation graph for the FEP calculation, including updating the molecule pair build perturbation graph, construct atom mapping, etc.
| Window | Window Display | Operation / Parameters | Description | Notes |
| Pairs |
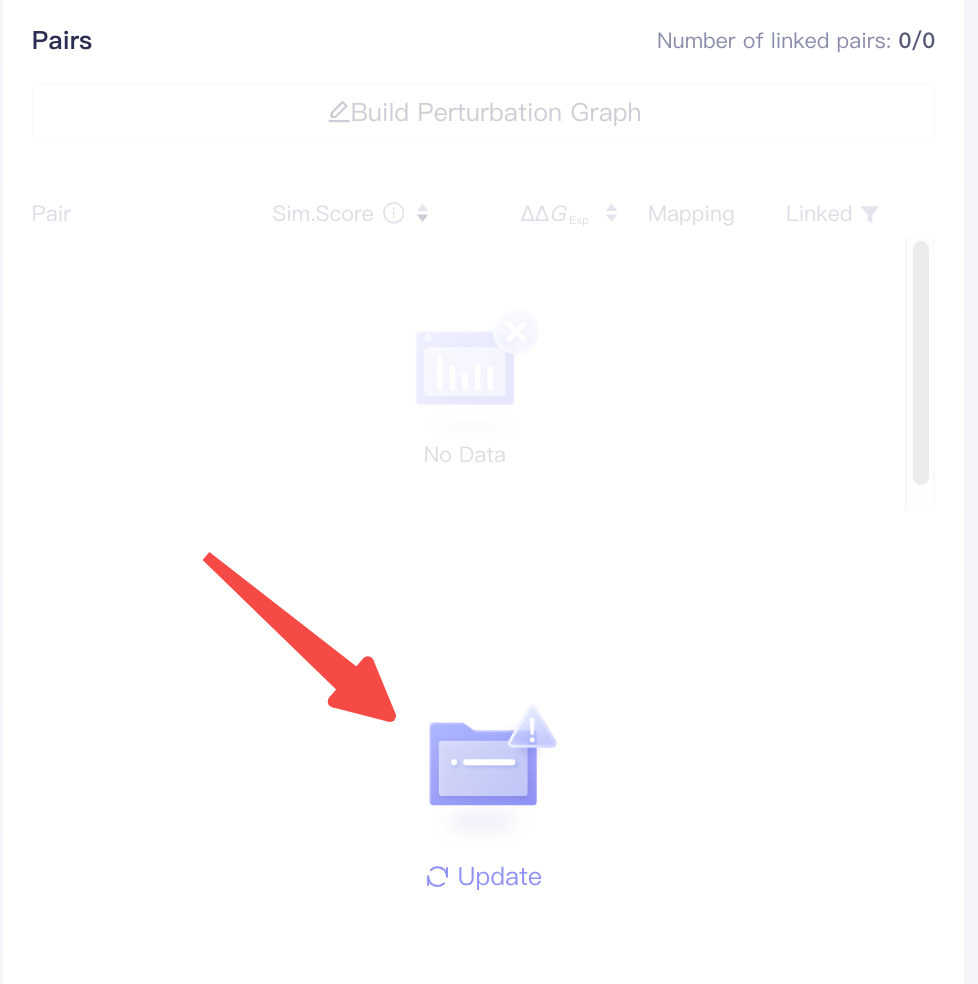
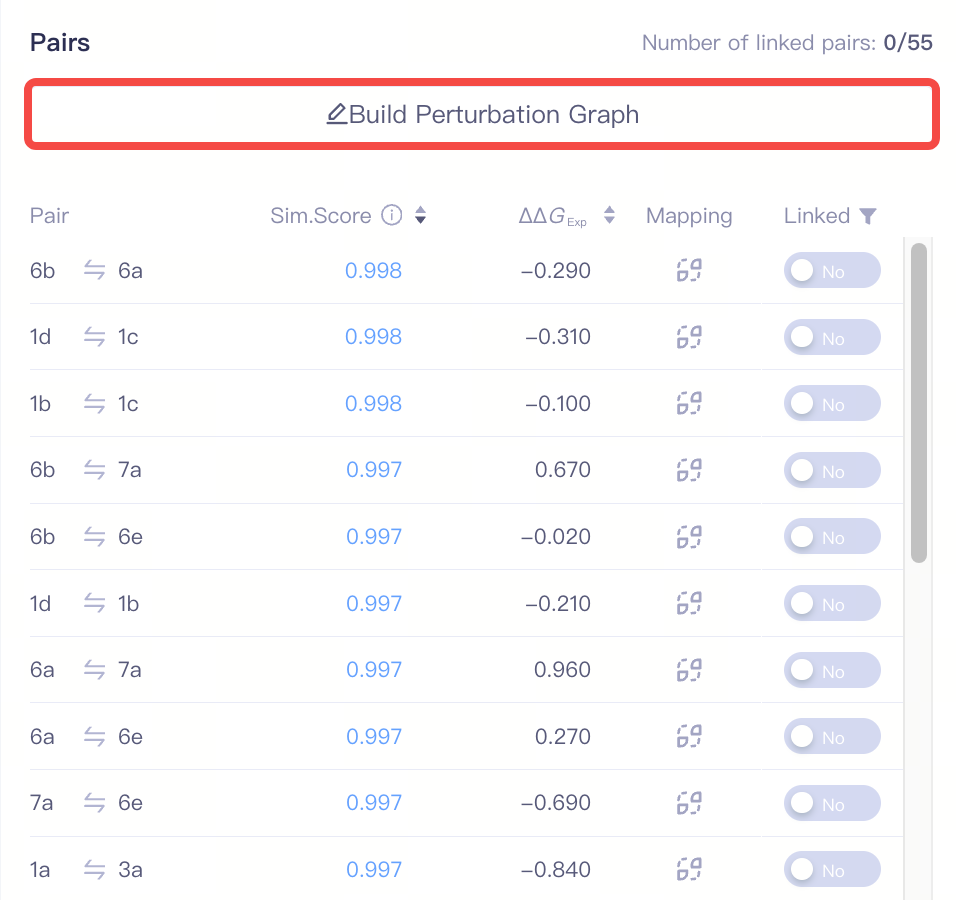
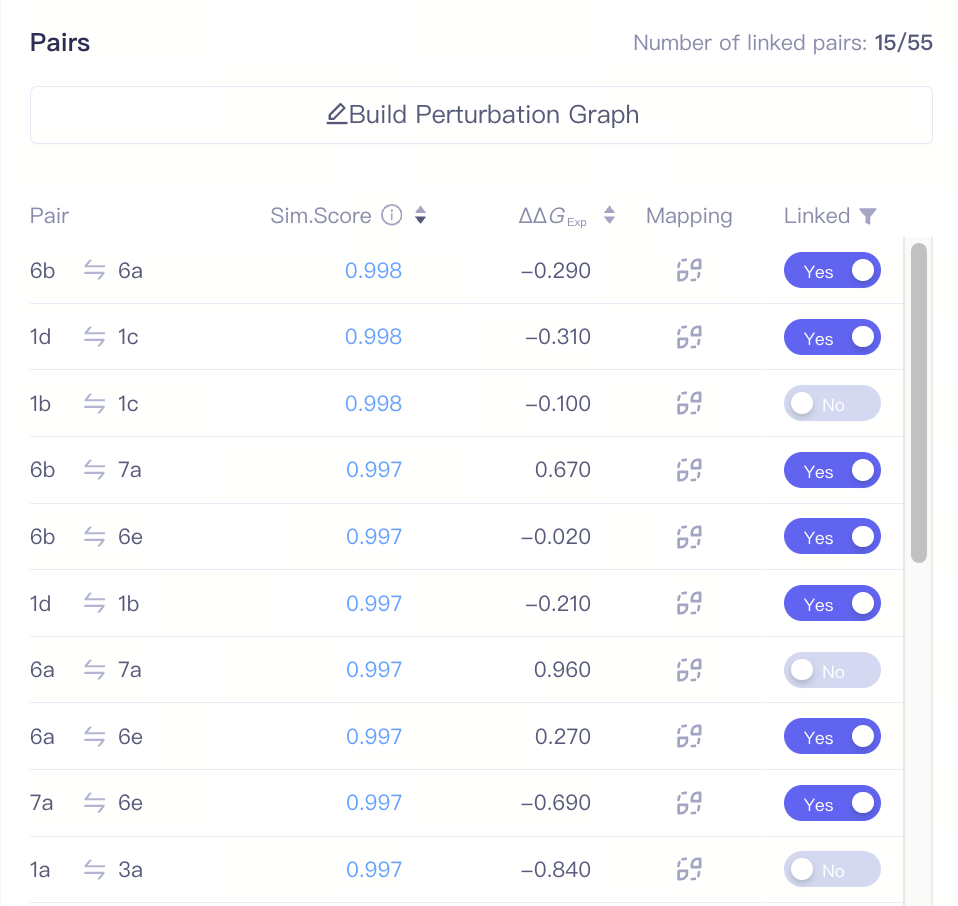
| Update | Update molecule pair pist | Whenever the ligand list is updated, click the Update button in the Pair window to update the molecule pair list. |
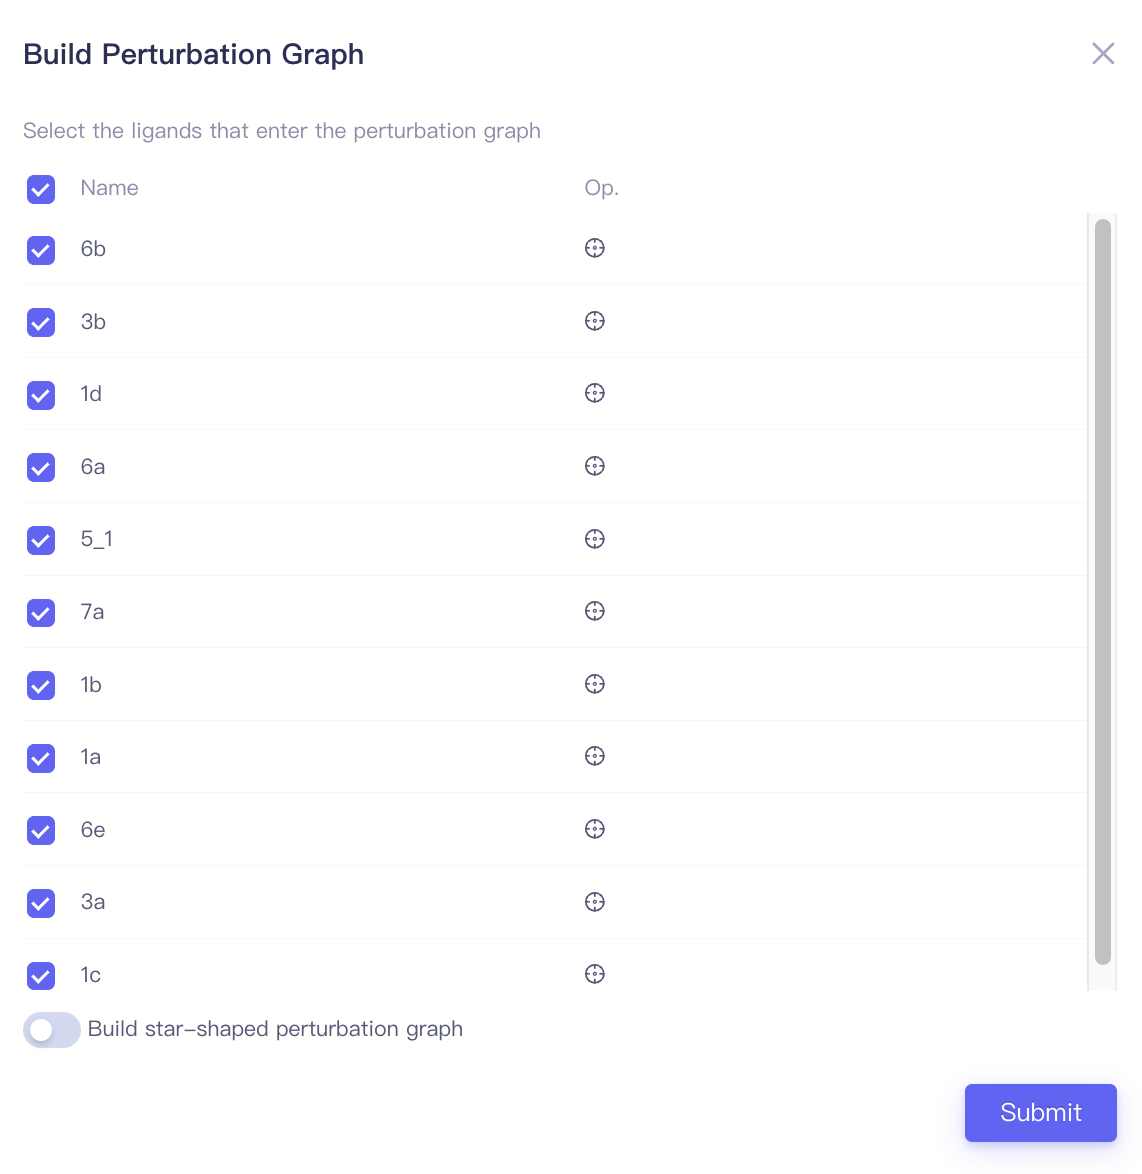
| Build Perturbation Graph | Build the Perturbation Graph | ||
| Build Perturbation Graph |
| Select ligands | Select the ligands that enter the perturbation graph | |
| Build star-shaped perturbation graph | Build star-shaped perturbation graph | After activating this function, select a ligand from the ligand list as the center of the star-shaped perturbation map (Select as Reference). | ||
| Pairs |
| Pair | Molecule pair | |
| Sim. Score | The structural similar score between two ligands in a molecule pair | Based on a reasonable atom mapping relationship, the similarity score is comprehensively evaluated across the following dimensions: intermolecular charge distribution, conformational differences in the core region, spatial alignment of ring systems, bond formation/breakage changes, and features of virtual atom regions. The similarity score directly impacts the success rate of perturbation pair calculations. Pairs with a similarity score < 0.001 cannot be linked. If two ligands in a pair have different net charges, the similarity score will be significantly lower. | ||
| ΔΔGExp | The difference in experimental measured binding free energy values between the two ligands in a pair. | This value is obtained by subtracting the former ligand from the latter ligand in the pair. | ||
| Linked | If a molecule pair is linked | |||
| Mapping | Atom mapping of the pair | Click this button to view the detailed Atom Mapping information. |
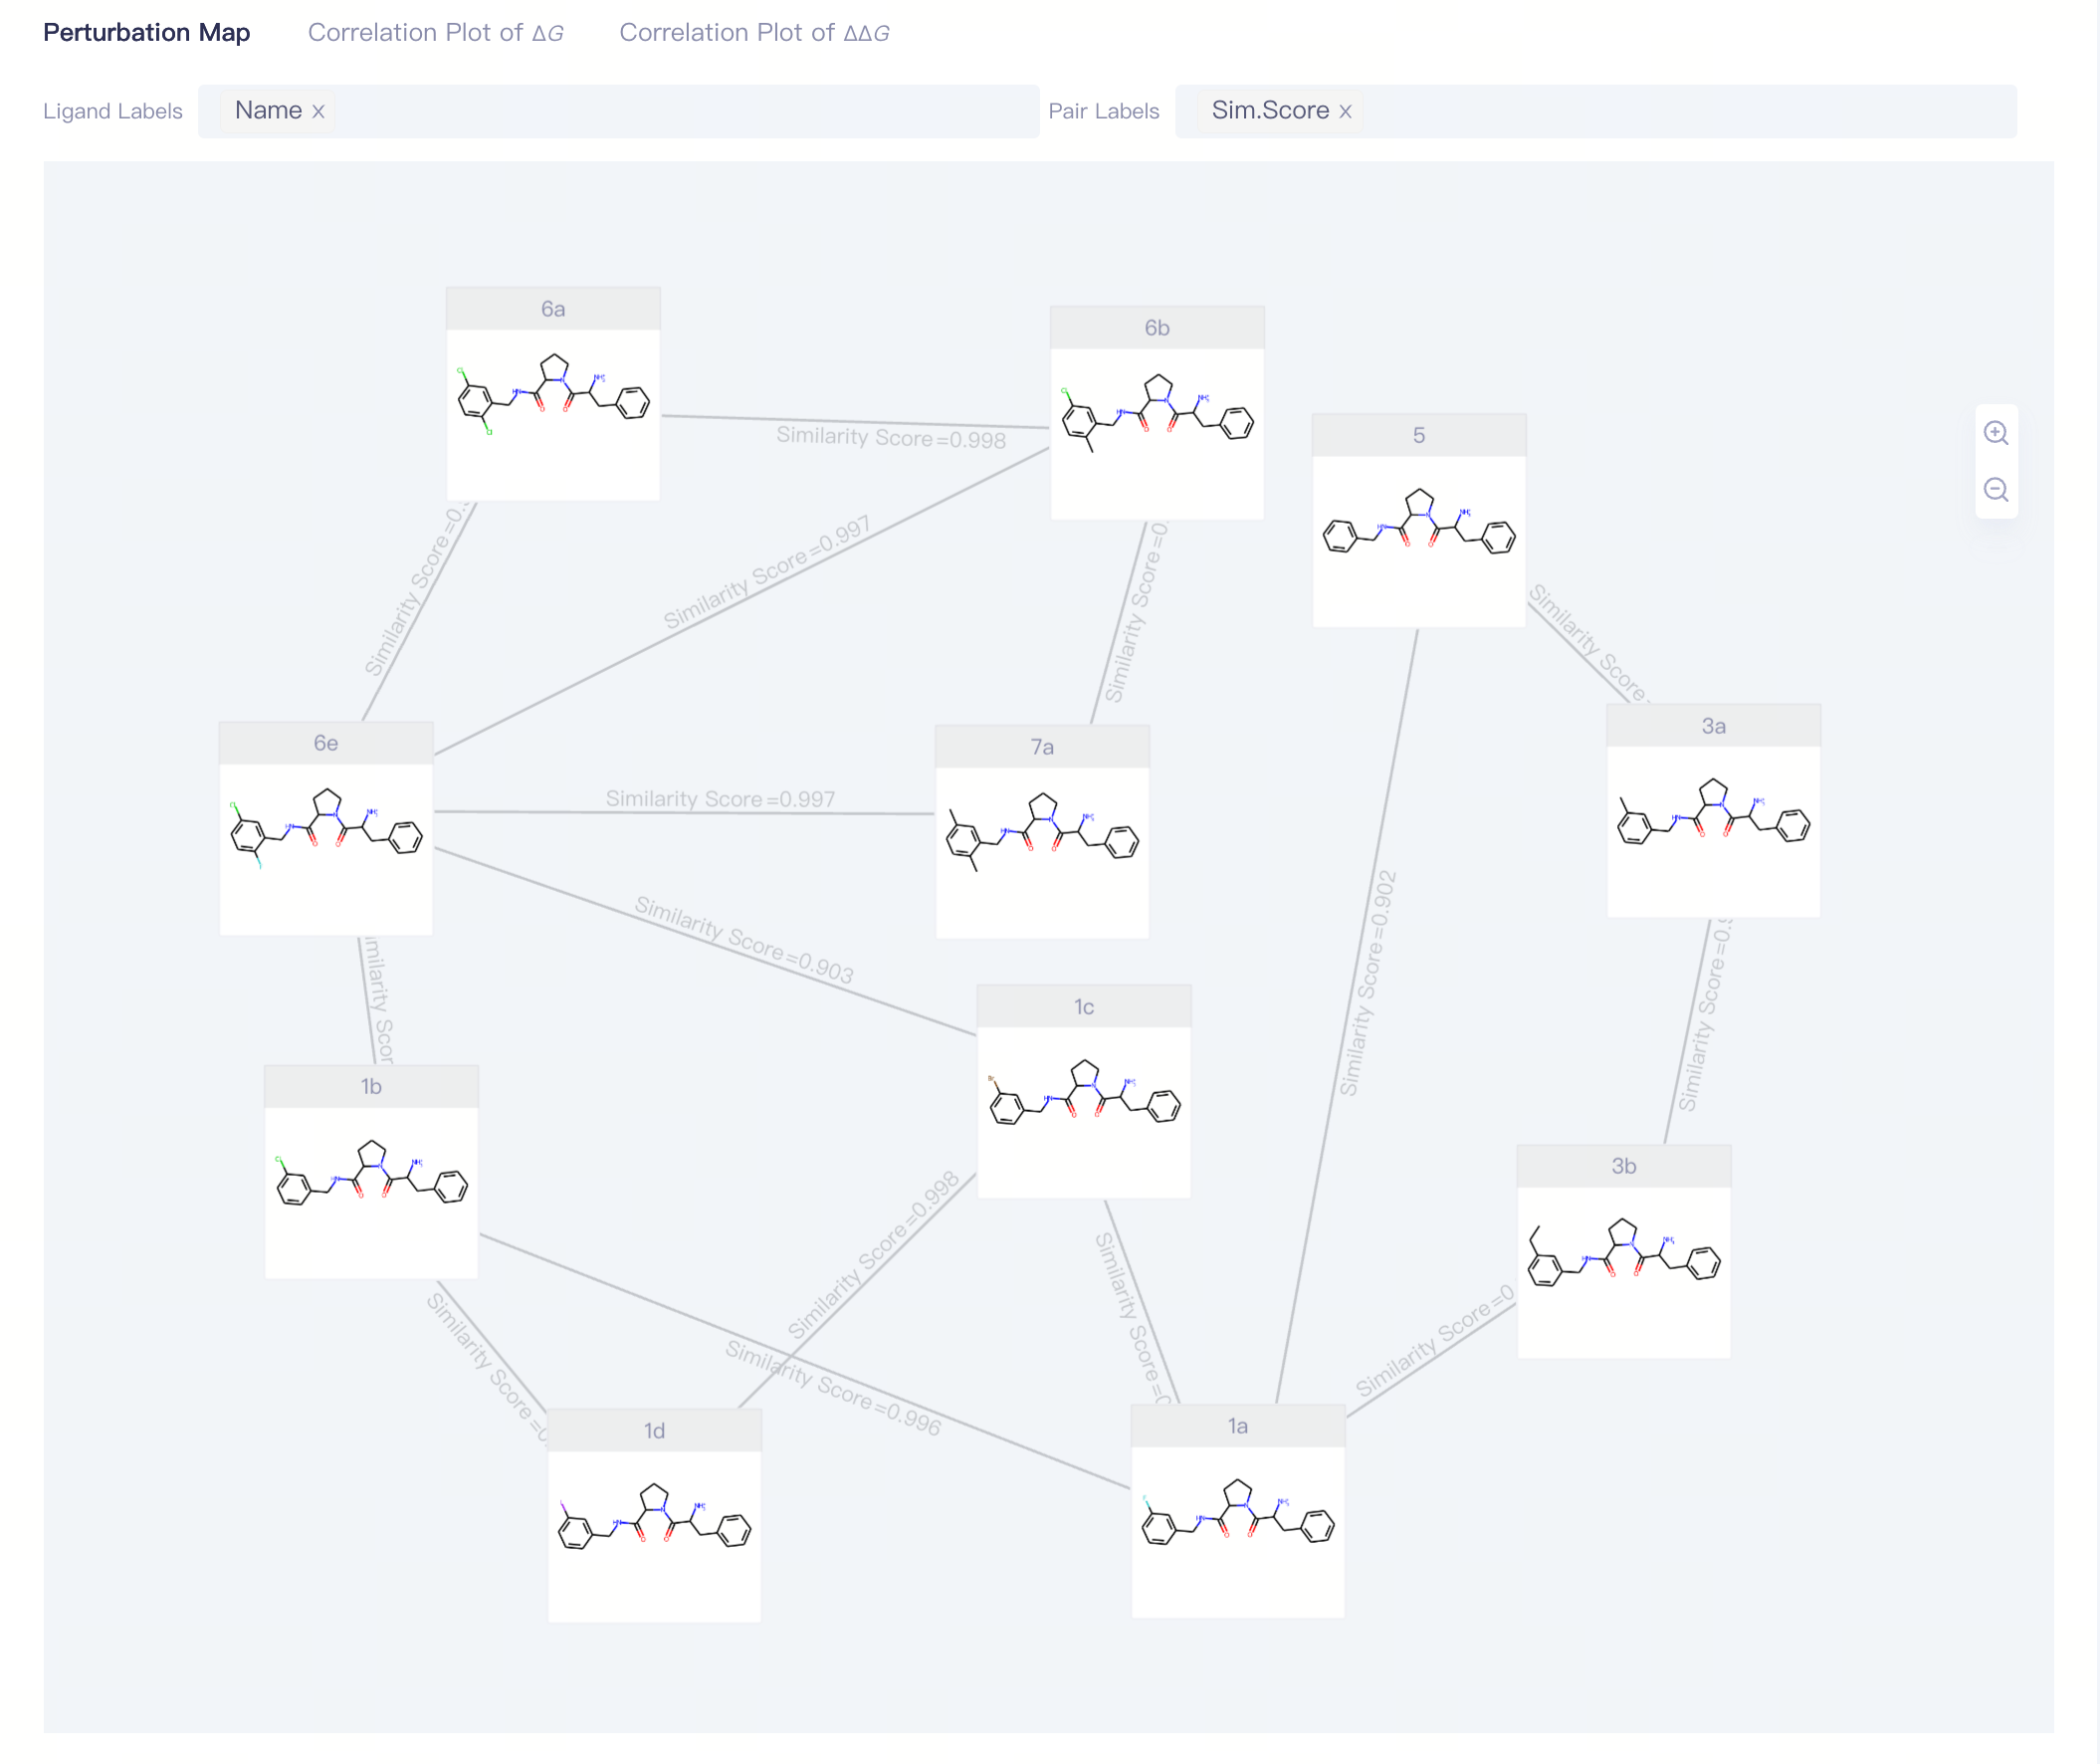
1.3.1 View Interface:Perturbation Graph
Perturbation
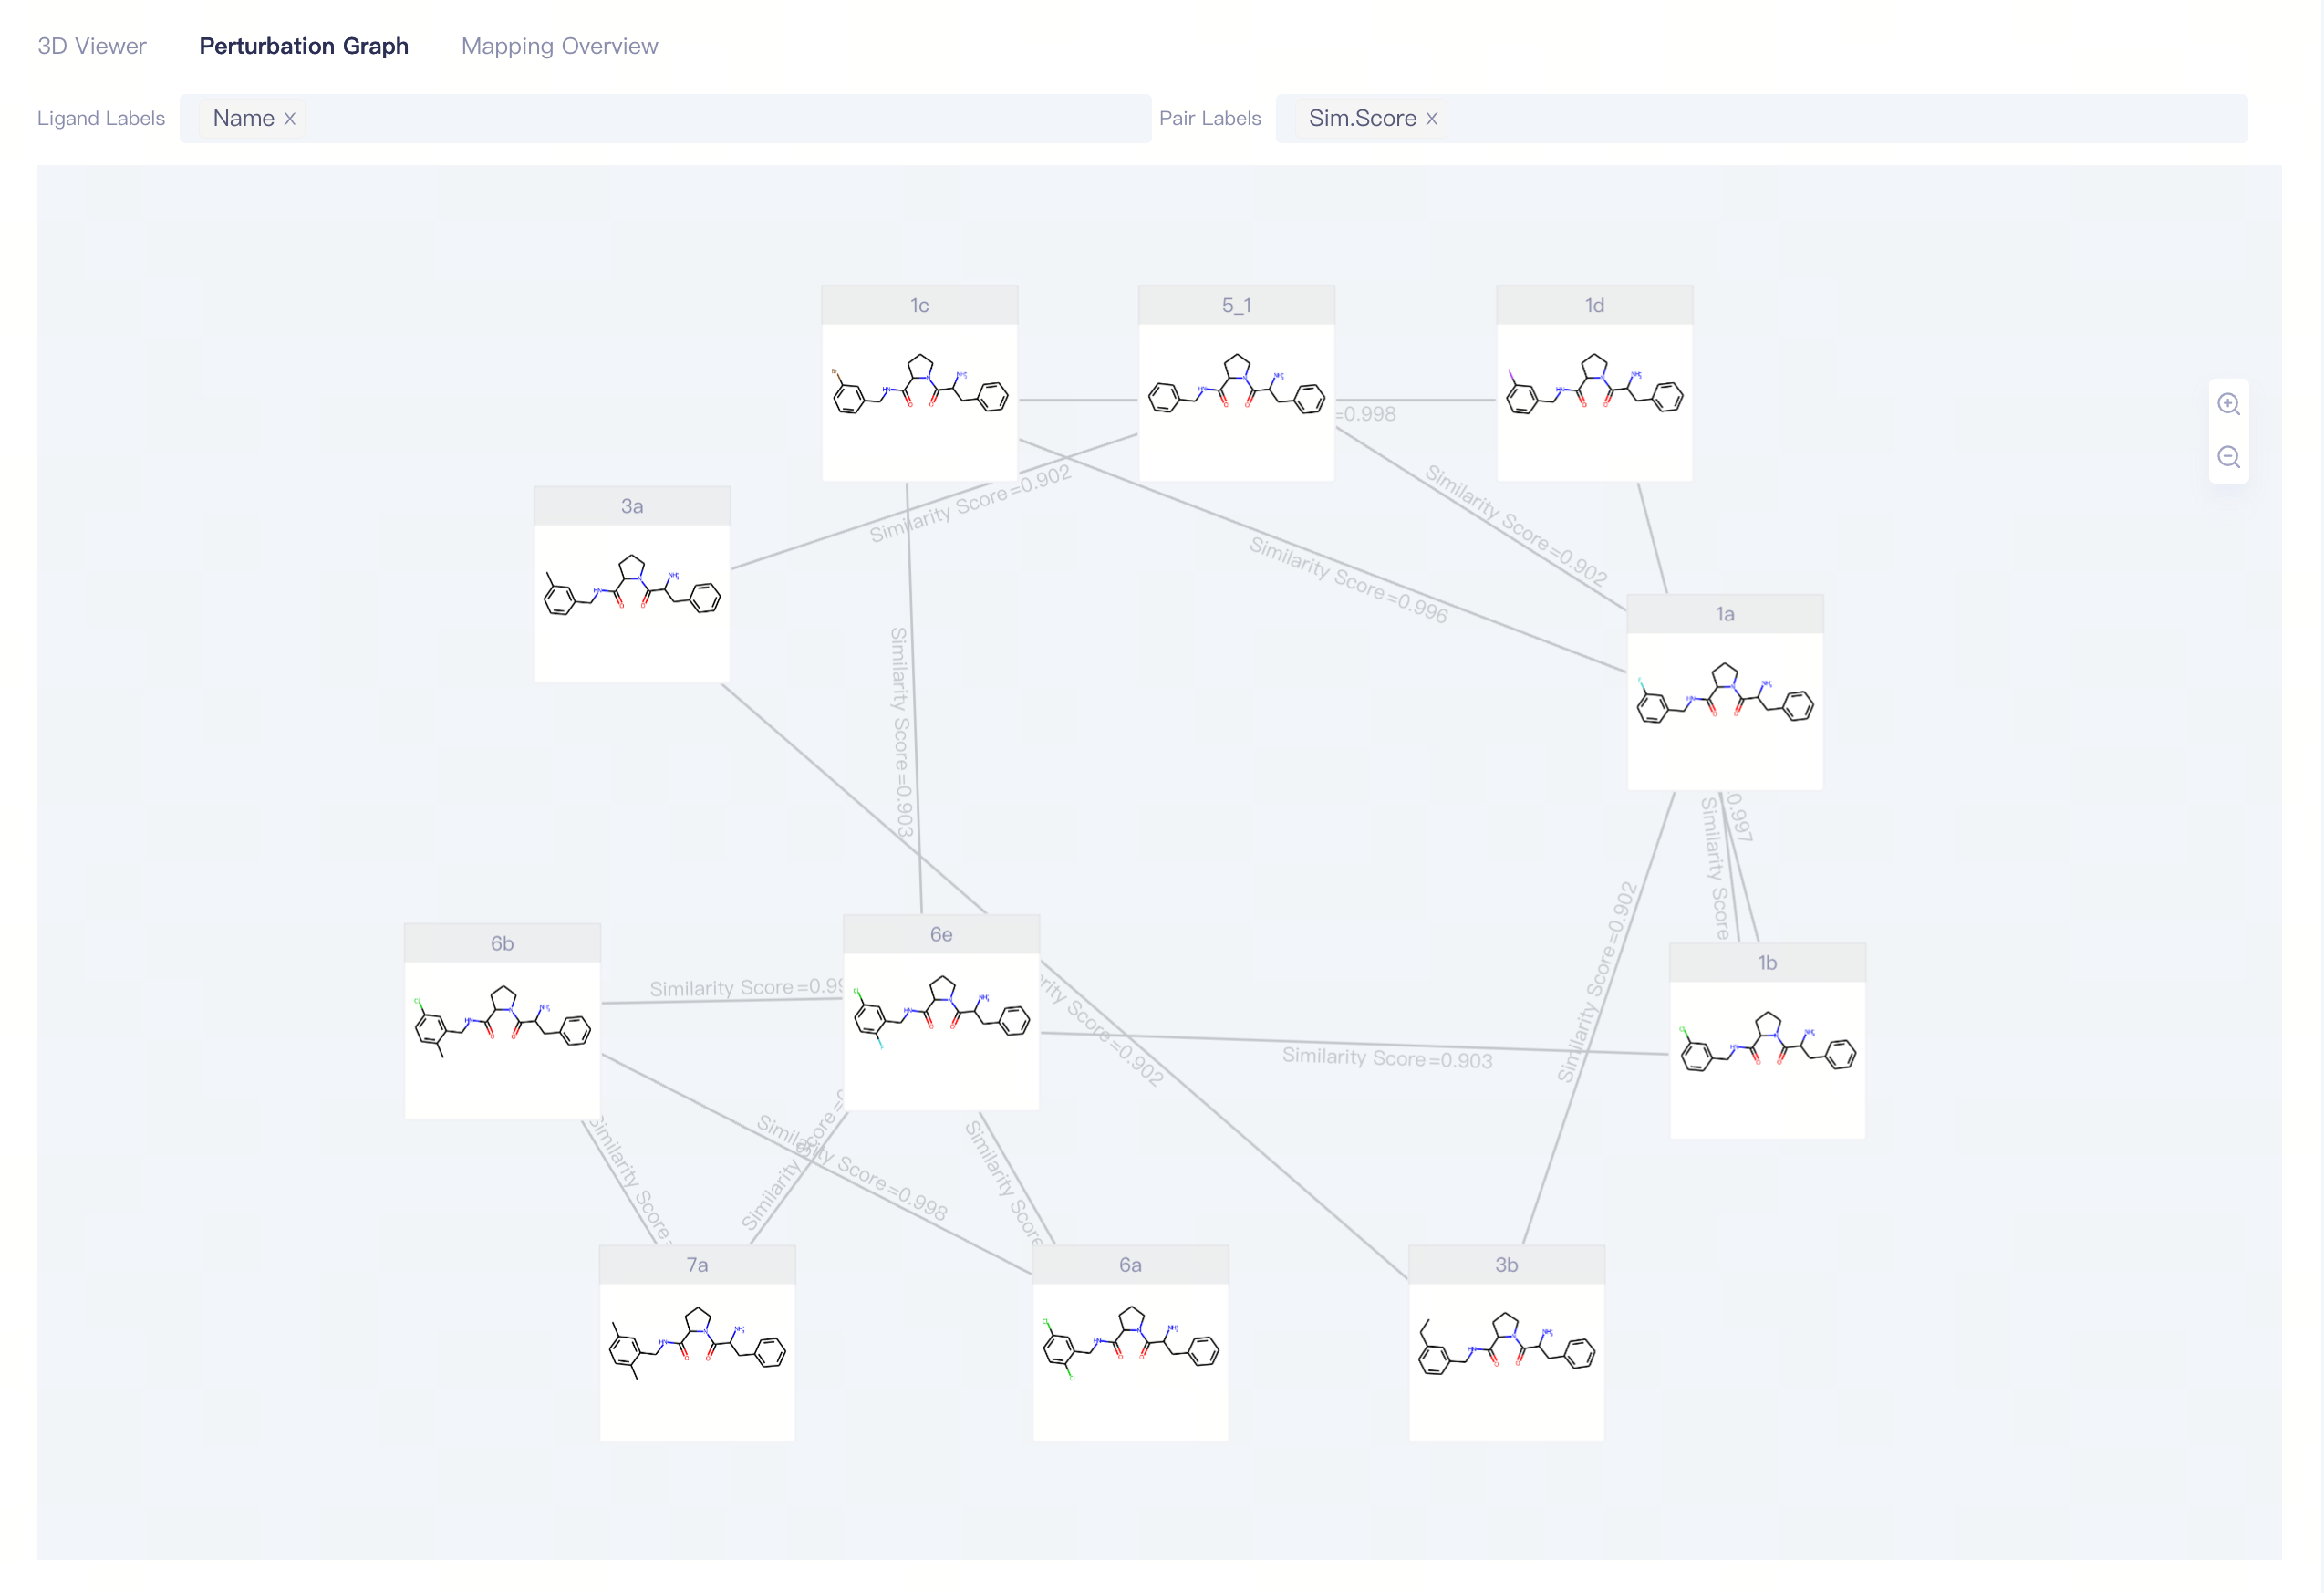
Display Options:
Ligand Labels:display the ligands information,supporting Name, ΔG_Exp, ΔG_FEP and δ(ΔG_FEP);
Pair Labels:display the pairs information,supporting Sim. Score and ΔΔG_FEP;
For system-generated pairs, modifications can be made using the toolbar on the right:
| Icon | Description | Notes |
| Zoom in on the perturbation graph | —— |
| Zoom out on the perturbation graph | —— |
| Determine perturbation graph from uploaded files | 1)Use the provided file as a template for uploading; 2)When a perturbation graph has already been constructed, uploading this file will replace the original perturbation map; |
| Delete a ligand | The Delete Ligand icon will only appear when a ligand is selected |
| Delete a pair | The Delete Edge icon will only appear when a pair is selected |
| Add a Pair | 1)The Add icon will only appear when operating on a pair; 2)Note that the edge has a direction, pointing from the first ligand to the second ligand. |
1.3.2 View Interface:Mapping
The Mapping Overview displays only 2D atom mapping by default,click on the “3D Mapping” button to view the 3D atom mapping.
|
|
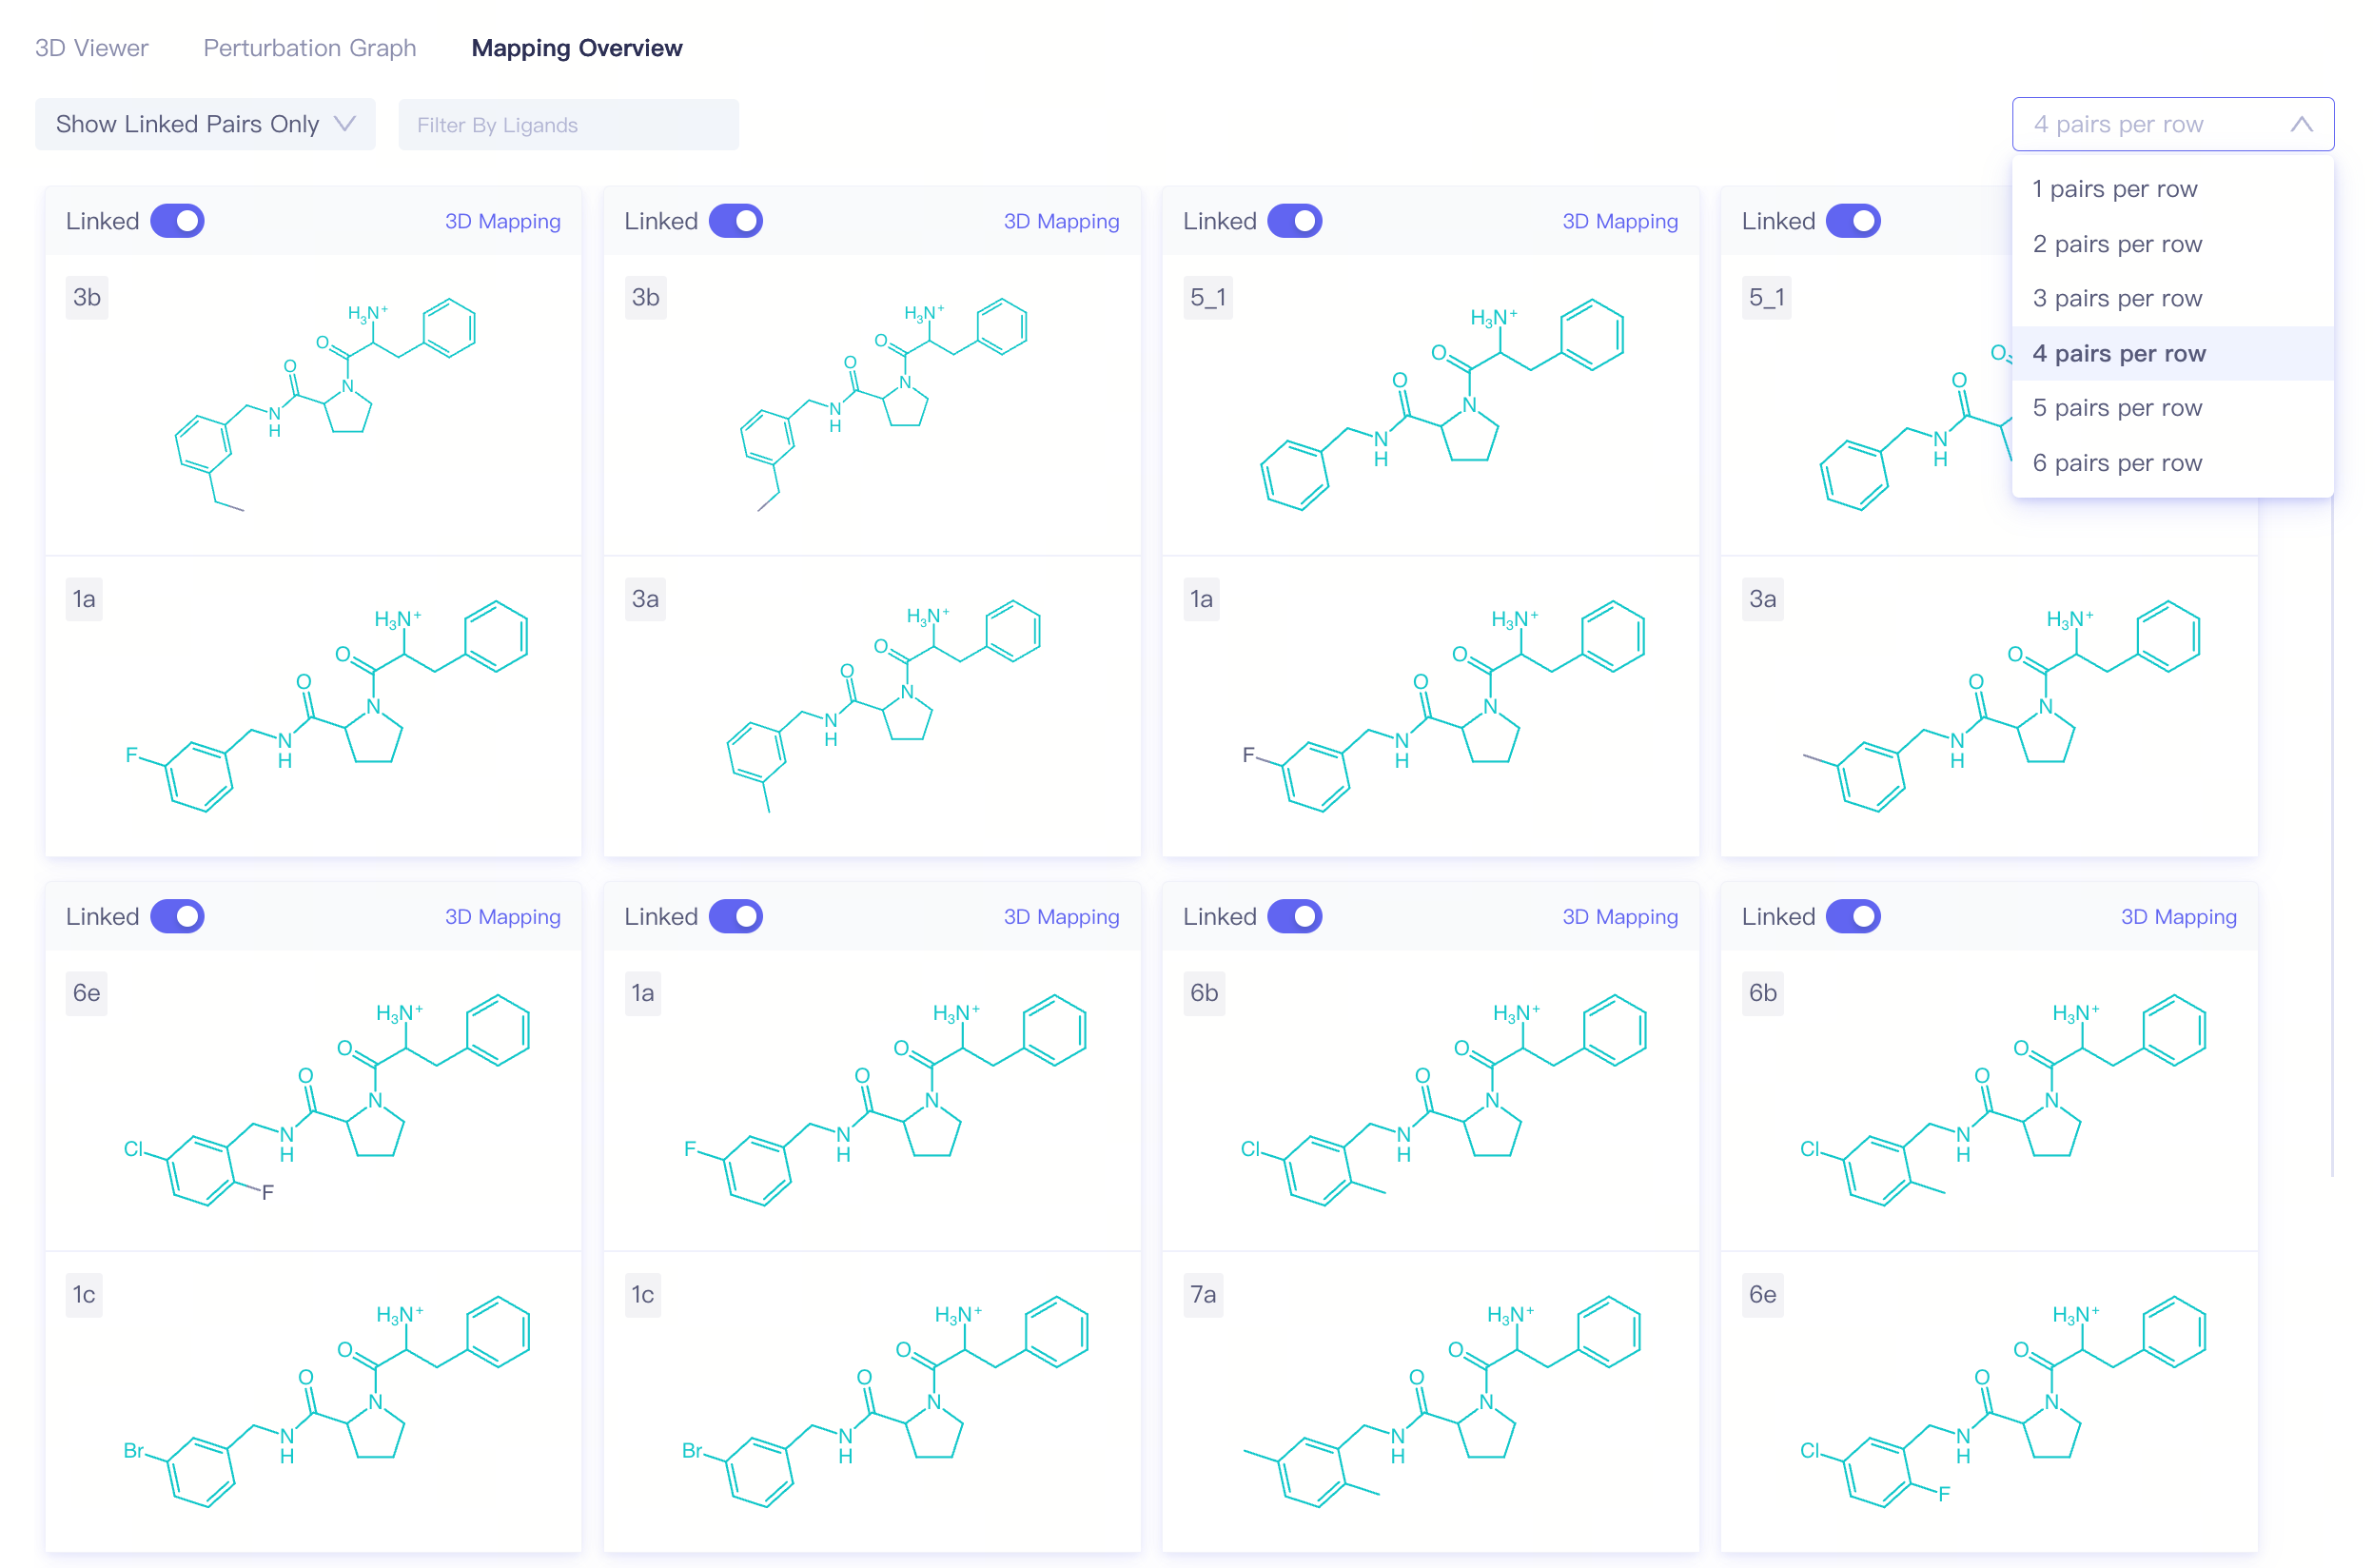
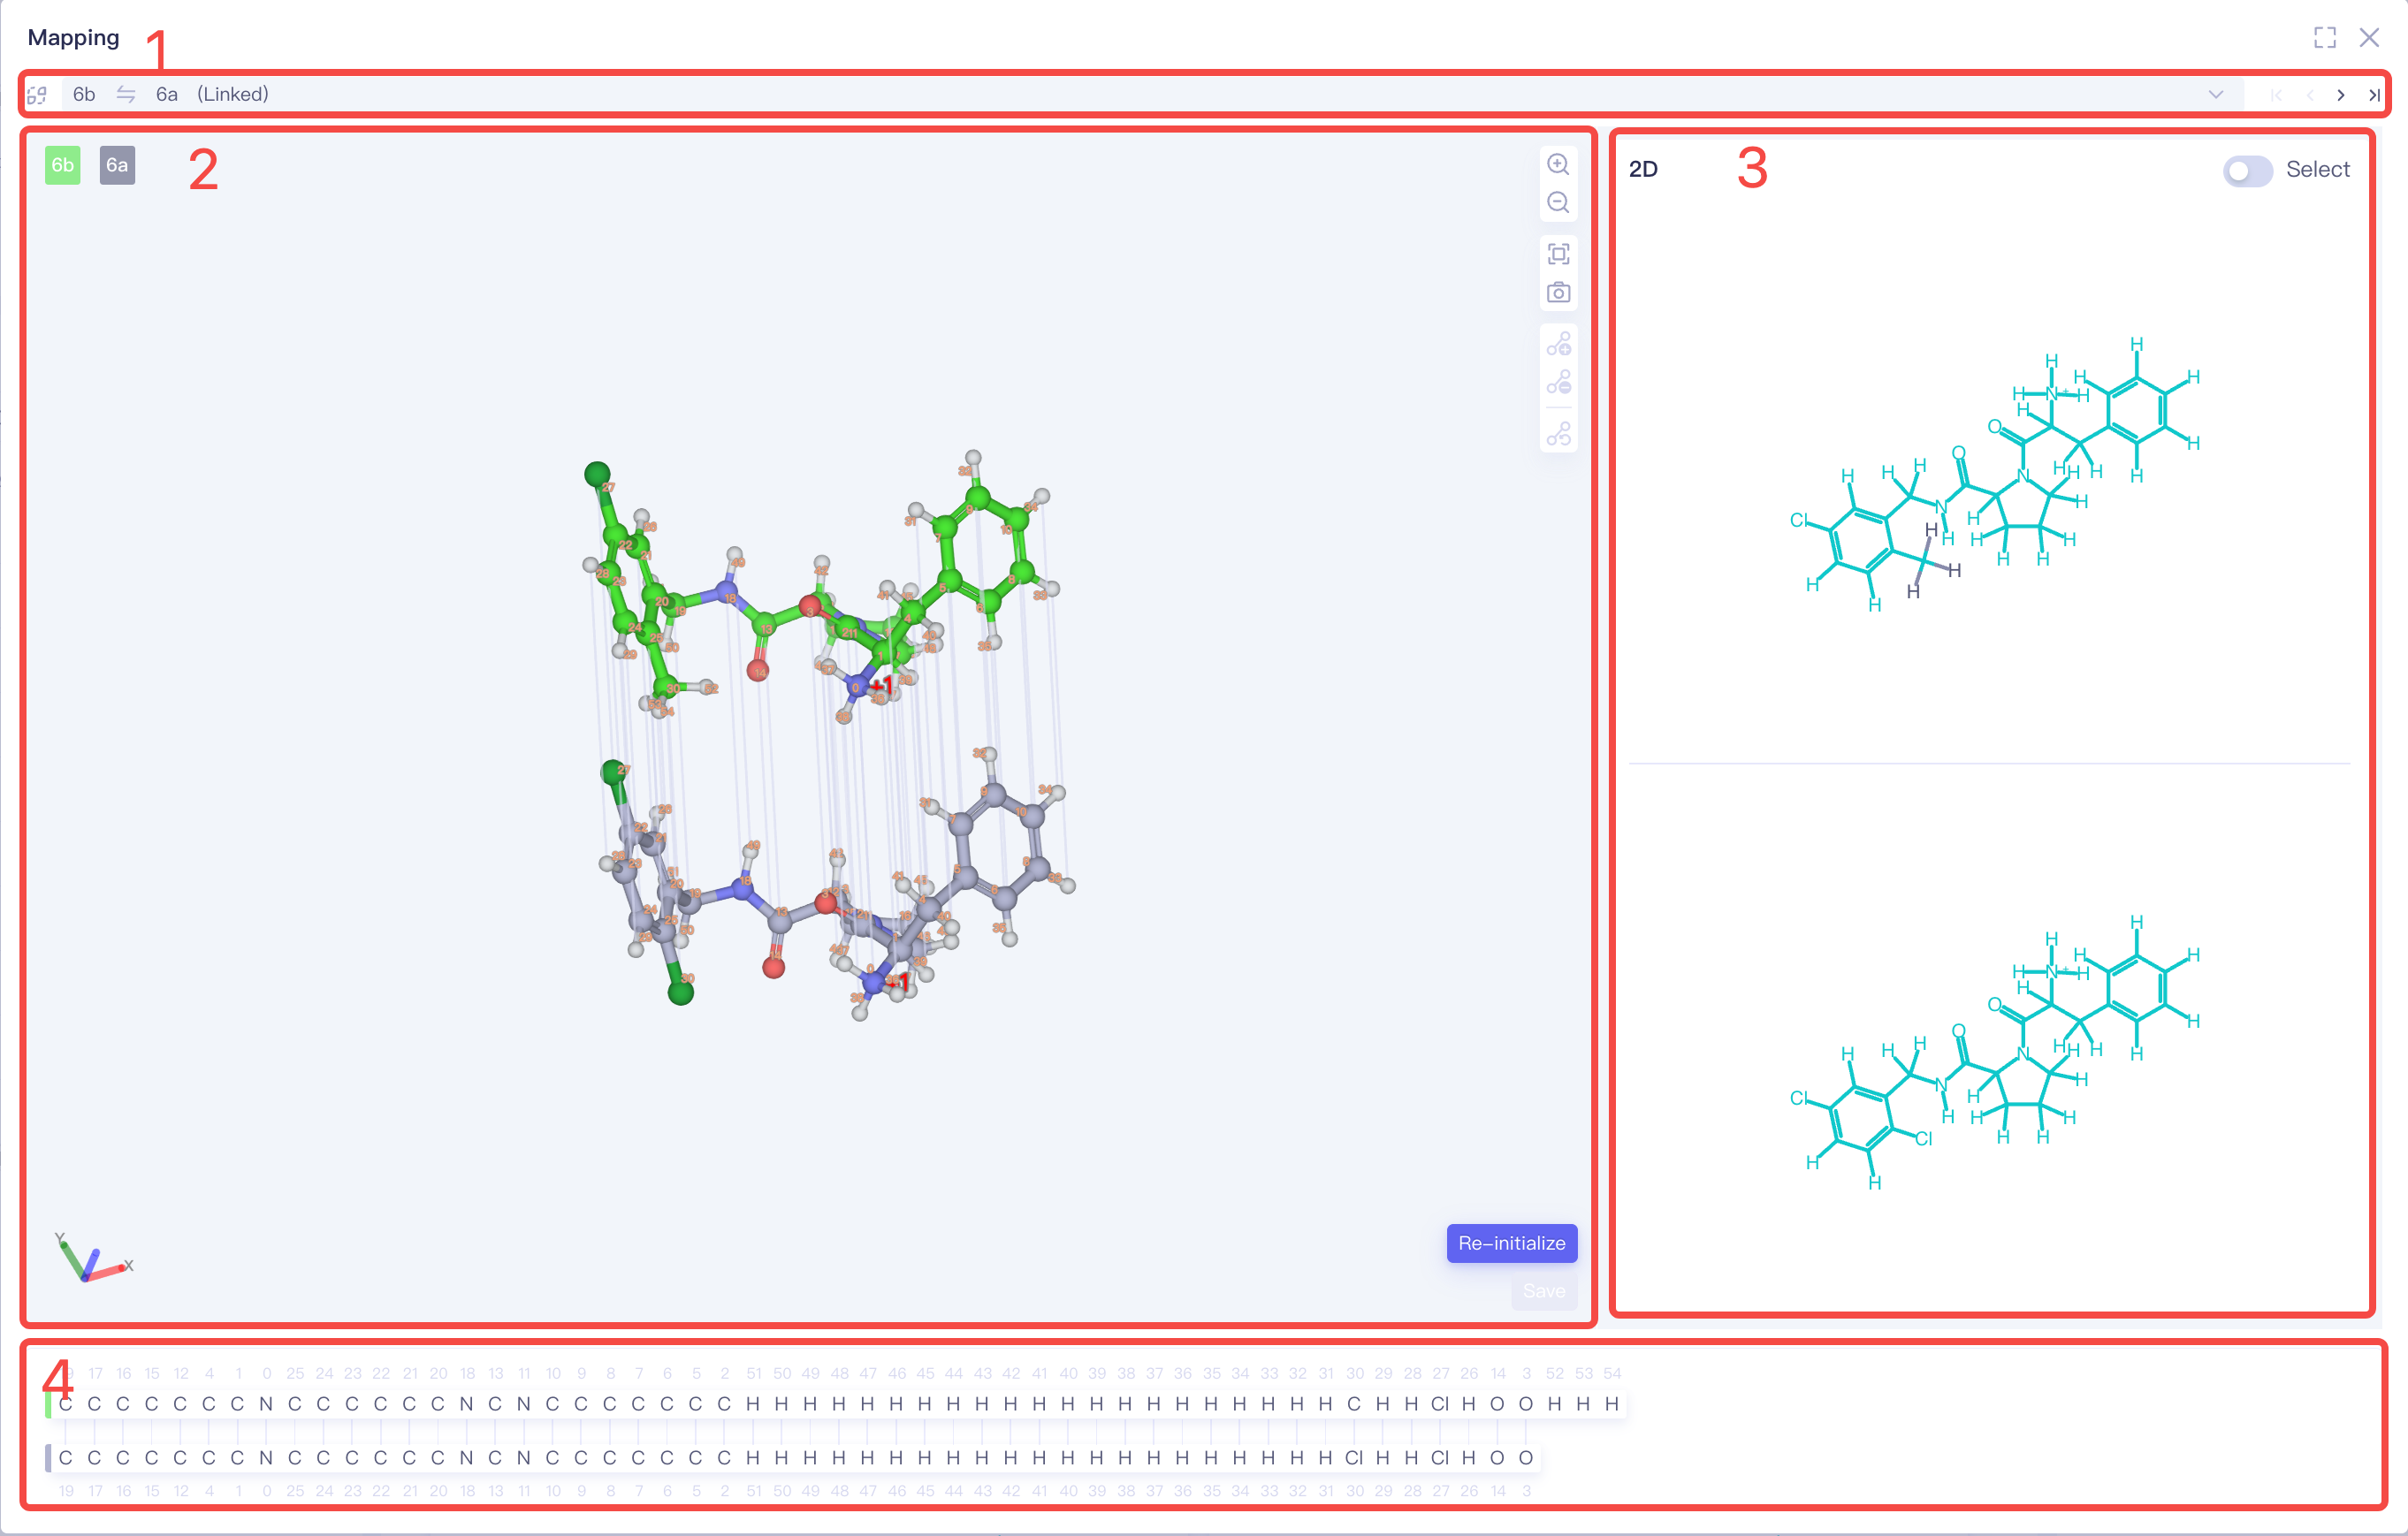
Mapping Overview
-
Filters:
Show Linked Pairs Only / Show All Pairs:Show only connected pairs / show all pairs;
Filter by Ligands:show only pairs that contain selected ligands;
-
N pairs per row:number of pairs displayed per row;
-
In the 2D atom mapping view, the green sections represent mapped molecule fragments, while the black sections indicate unmapped molecule fragments.
3D Mapping
-
Switch Between Pairs: Before switching, ensure you submit any modifications to the current pair; otherwise, unsaved changes will be lost.
-
3D View displays the 3D atom mapping between the two molecules in the pair, allowing for the addition or deletion of mapping connections individually.
-
Basic operations: Zoom in, zoom out, reset view, and refresh window.
-
"Re-Initialize": Reinitialize the mapping.
-
"Save": Saves current changes.
- 2D View displays the 2D atom mapping between the two molecules.
- When the "Select" button (top right) is enabled, you can use box selection to select molecular fragments for batch linking or unlinking operations.
- Correspondence with the 3D View: The 2D mapping corresponds directly to the 3D atomic representation, enabling quick verification of mapping connections.
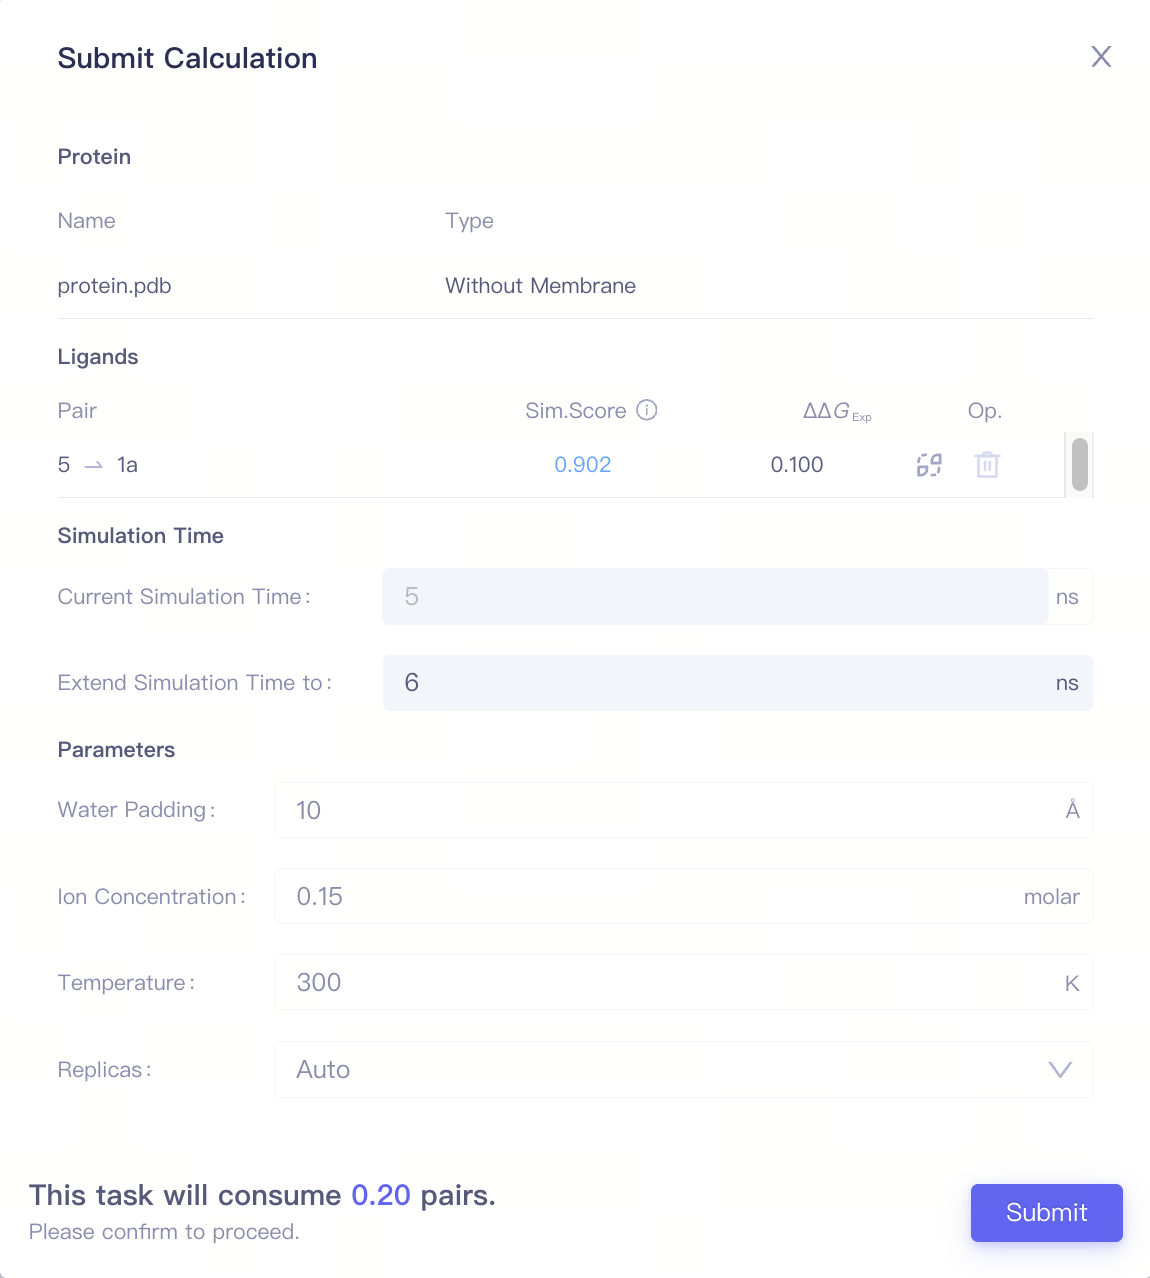
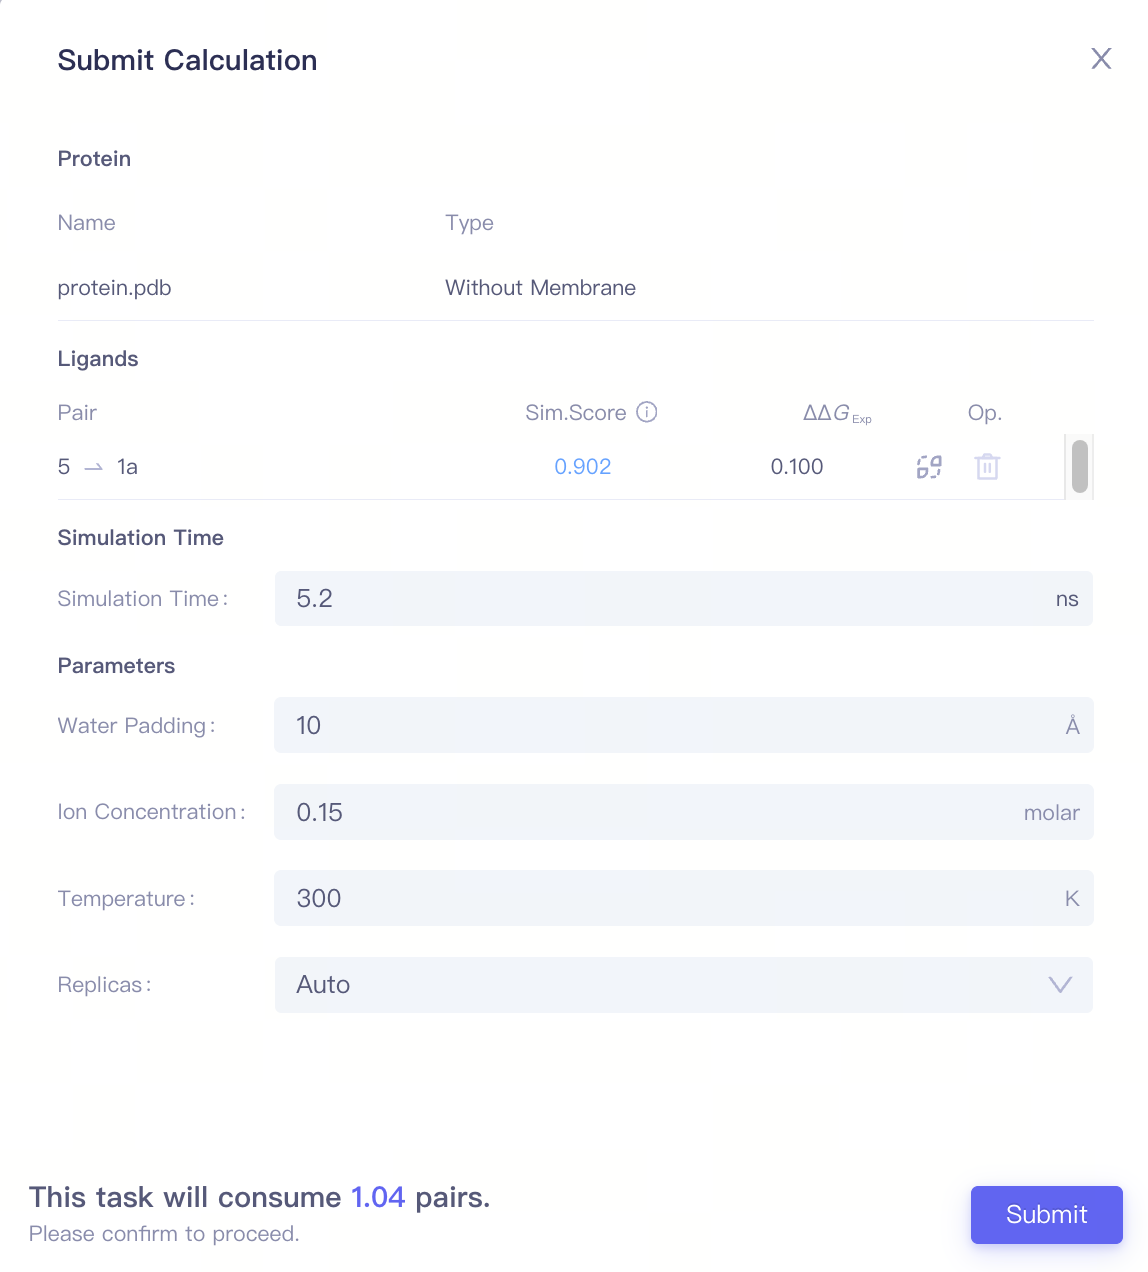
1.4 Job Submission
Click the Configure Calculationbutton to enter the Submit Calculation interface.
| Items | Parameters | Notes |
| Protein | Include the protein name and the protein category (with / without a membrance) | |
| Ligands | Include pairs and corresponding Sim. Score, ΔΔG_Exp, Op. (Mapping/Delete) of each pair | |
| Simulation Time | Simulation Time | It is recommended to start the calculation with 5ns, and increase simulation time when needed. |
| Parameters | Water Padding | Recommend to use the default value |
| Ion Concentration | Recommend to use the default value | |
| Temperature | Recommend to use the default value | |
| Replicas | Recommend to use the default value | |
| Costs | This task will consume N pairs. | Job cost is determined by the submitted protein system (with or without membrane), the number of molecule pairs, simulation duration, and the number of replicas. |
2. RBFE Jobs
The RBFE Jobs interface provides calculation information for each molecule pair.
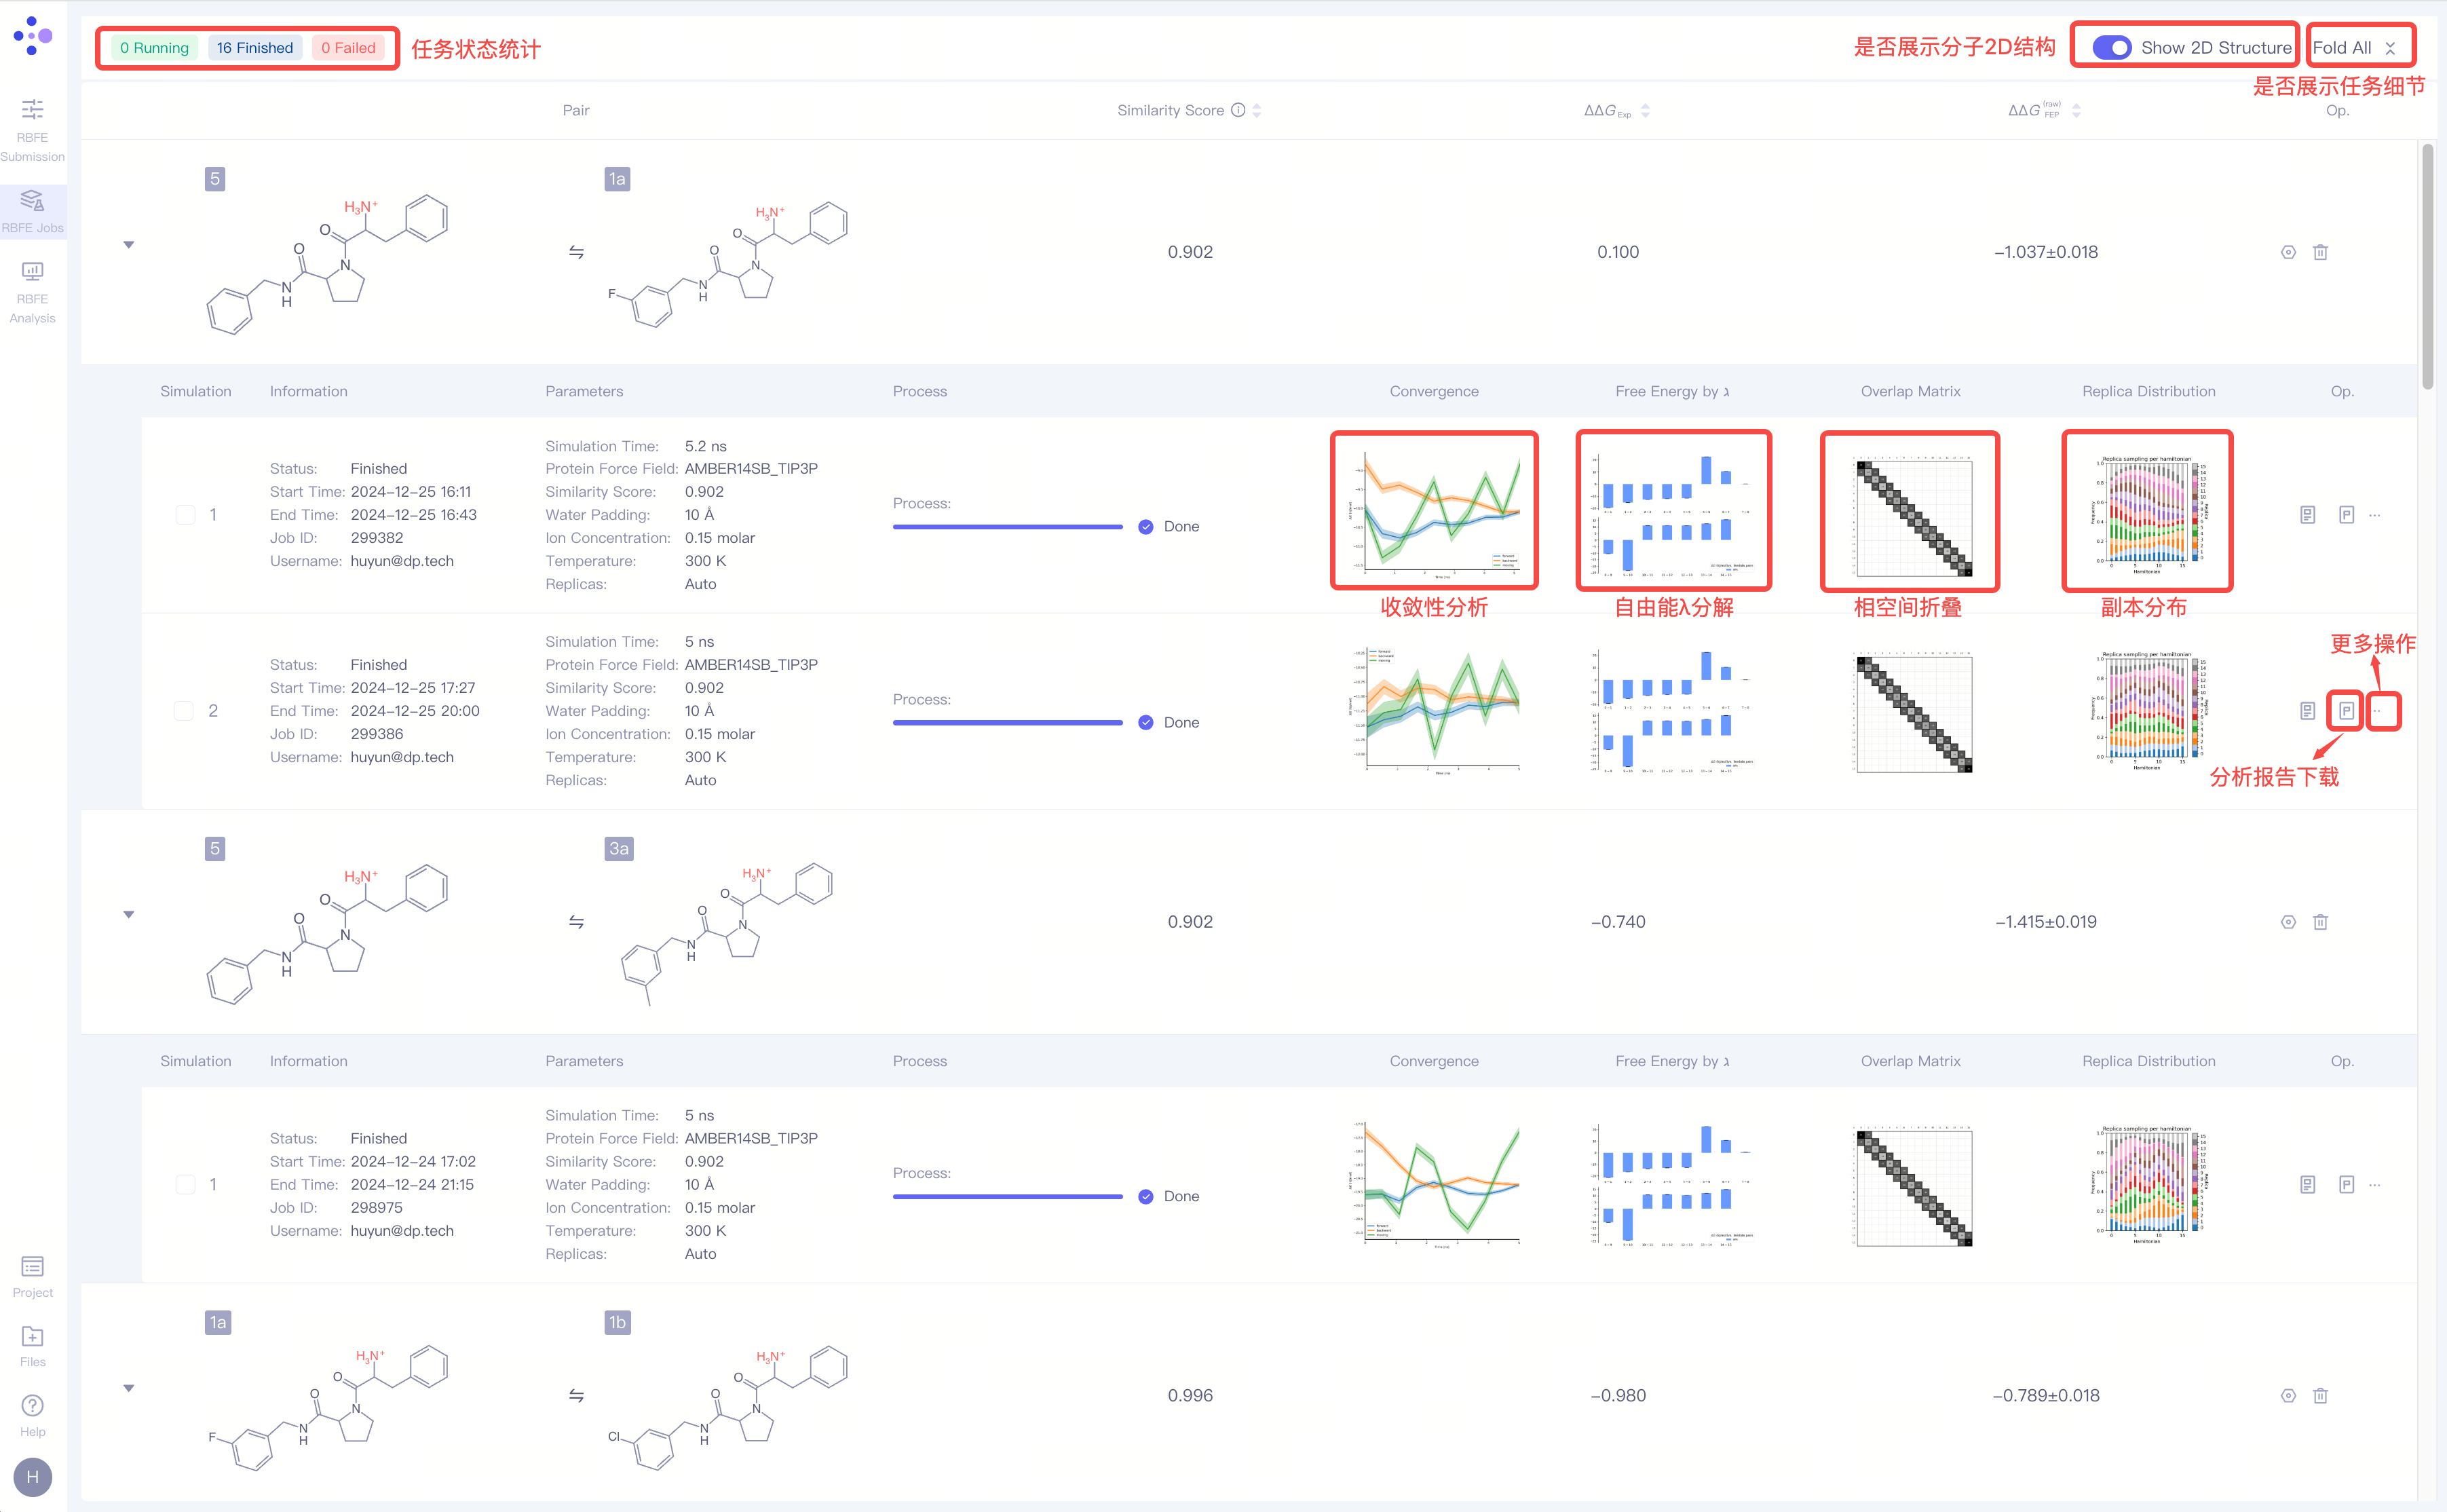
2.1 Calculation Result of a Single Molecule Pair
| Items | Description | Operation example |
| Pair | Pair name | —— |
| Similarity Score | Similarity Scoe | —— |
| ΔΔG_Exp | The difference in experimental measured binding free energy values between the two ligands in a pair. | —— |
| ΔΔG_FEP(raw) | The difference in FEP computed binding free energy values between the two ligands in a pair, without thermodynamic calibration | —— |
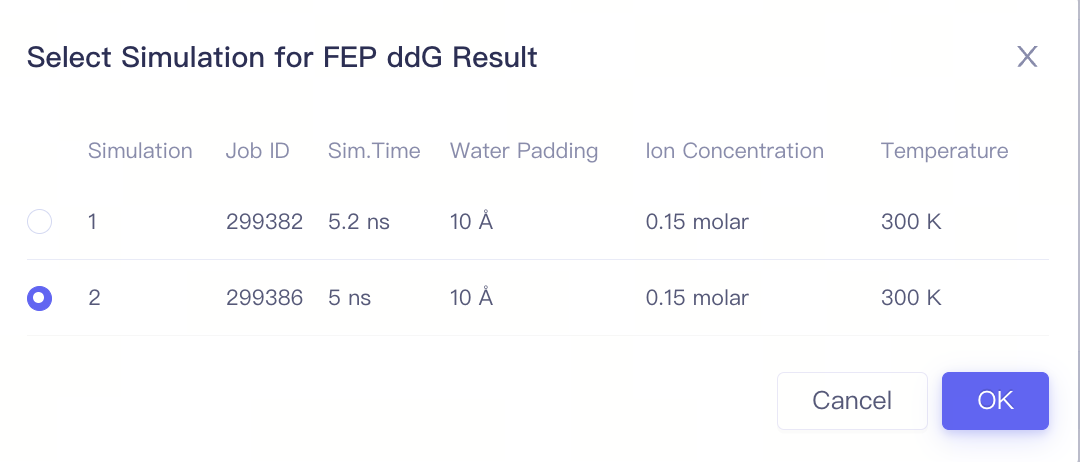
| Op. | Setting Select one calculation result of this pair to perform result analysis |
|
| Delete Delete all jobs related to this pair |
|

2.2 Analysis Result of a Single Molecule Pair
| Itmes | Operations / Settings | Description | Notes |
| Simulation | —— | The index of the simulation | |
| Information | Status: job status Start Time: Job start time End Time: Job end time Job ID: Job ID Username: Username | ||
| Parameters | —— | The same as parameters used for submitting the job | |
| Process | —— | Job process | |
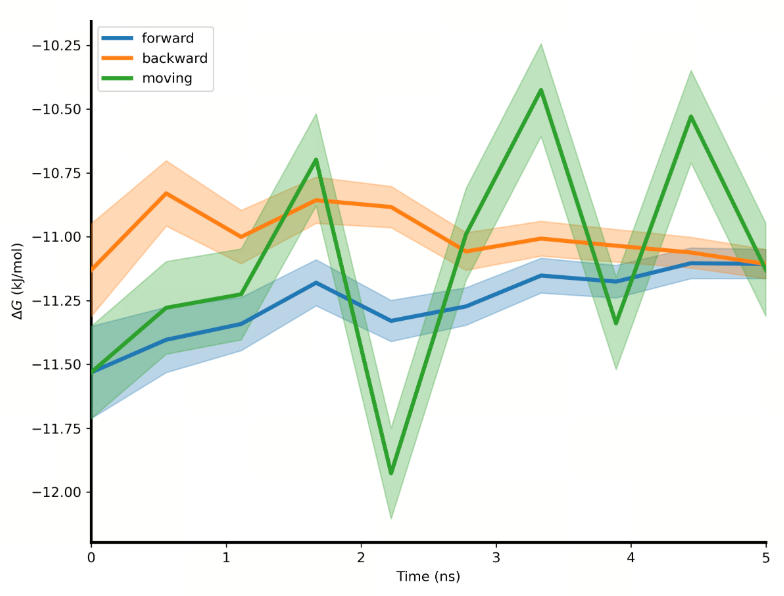
| Convergence |
| Convergence analysis | The convergence analysis shows the difference between the forward and the reverse free energy calculation results, which reflects the extent of hysteresis. Ideally, the difference between forward and reverse results should be small, indicating that the system has fully converged and sampling deviations are negligible. A large difference usually means insufficient state overlap or inadequate sampling. In addition, a smooth and stable moving average suggests that the free energy value has converged, while a continuously changing moving average indicates that the system is not fully converged and still evolving. |
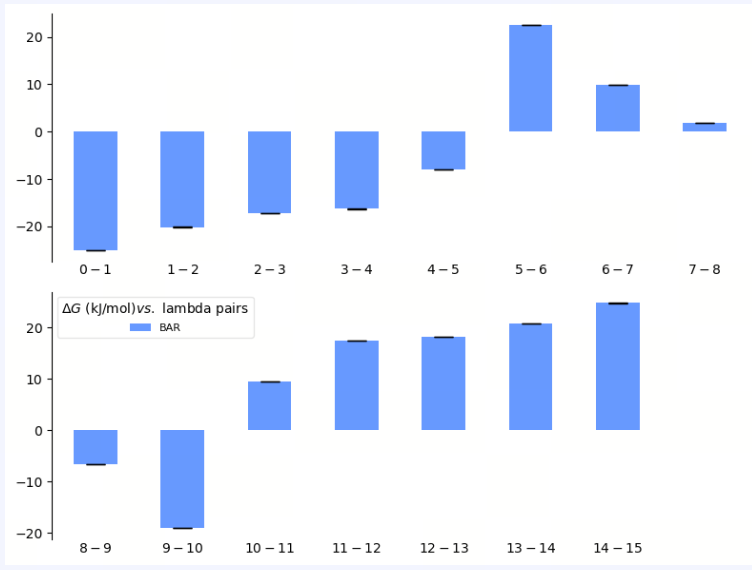
| Free Energy by ℷ |
| λ Decomposition of the Free Energy | The λ decomposition of free energy shows the free energy change across different λ states in the system. If ΔΔG values change smoothly across different λ values, it indicates that the system has a stable transition during the alchemical transformation process. Abrupt jumps at certain λ values may indicate critical transition points, insufficient sampling, or system instability. |
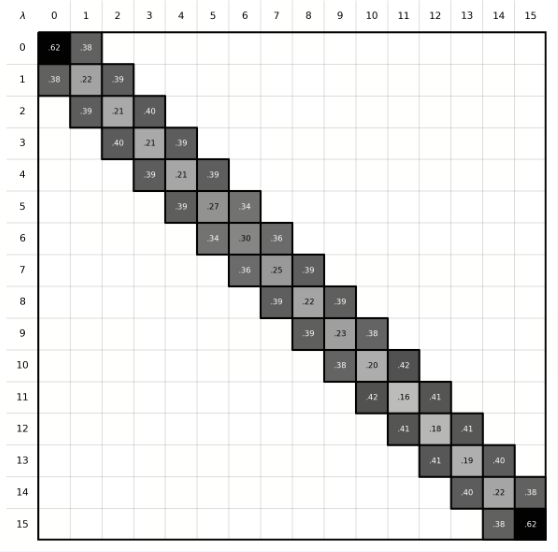
| Overlap Matrix |
| Phase Space Overlap | In FEP calculations, the ligand A must be perturbed into ligand B through a series of well-overlapping intermediate λ states to obtain accurate results. The phase-space overlap matrix visualizes the conformational sampling overlap between different λ states. Each cell value represents the degree of conformational space shared between two adjacent λ windows, with higher values (typically recommended to be greater than 0.15) indicating smoother transitions between states and more reliable calculations. If certain regions show low overlap, it may suggest significant energy barriers or insufficient sampling between states. |
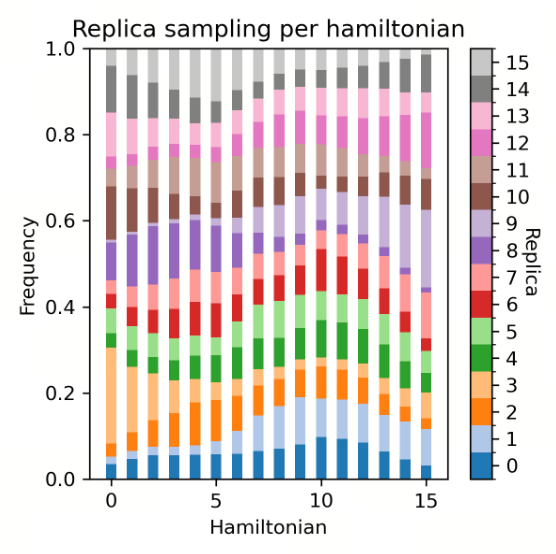
| Replica Distribution |
| Replica Distribution | The replica distribution shows the sampling coverage across different λ states. A uniform distribution indicates that all λ states have been sufficiently sampled, and the sampling is stable and even across all intervals. An uneven distribution may suggest sampling bottlenecks or energy barriers in certain λ intervals, which can affect the accuracy of the final free energy. |
| Op. | log | Log | |
| Report | View and download the analysis report | ||
| ...-Mapping | View atom mapping | ||
| ...-Trajectory | View the MD trajectory | Provide visualization videos of the two molecules in apo states and complex states | |
| ...-Stop | Stop the job | ||
| ...-Extend | Extend the simulation time |
| |
| ...-Re-submit | Resubmitt the calculation |
| |
| ...-Delete | Delete this job |
3. RBFE Analysis
The RBFE Analysis interface is composed of three sections: the project overview, the view interface, and the job list.
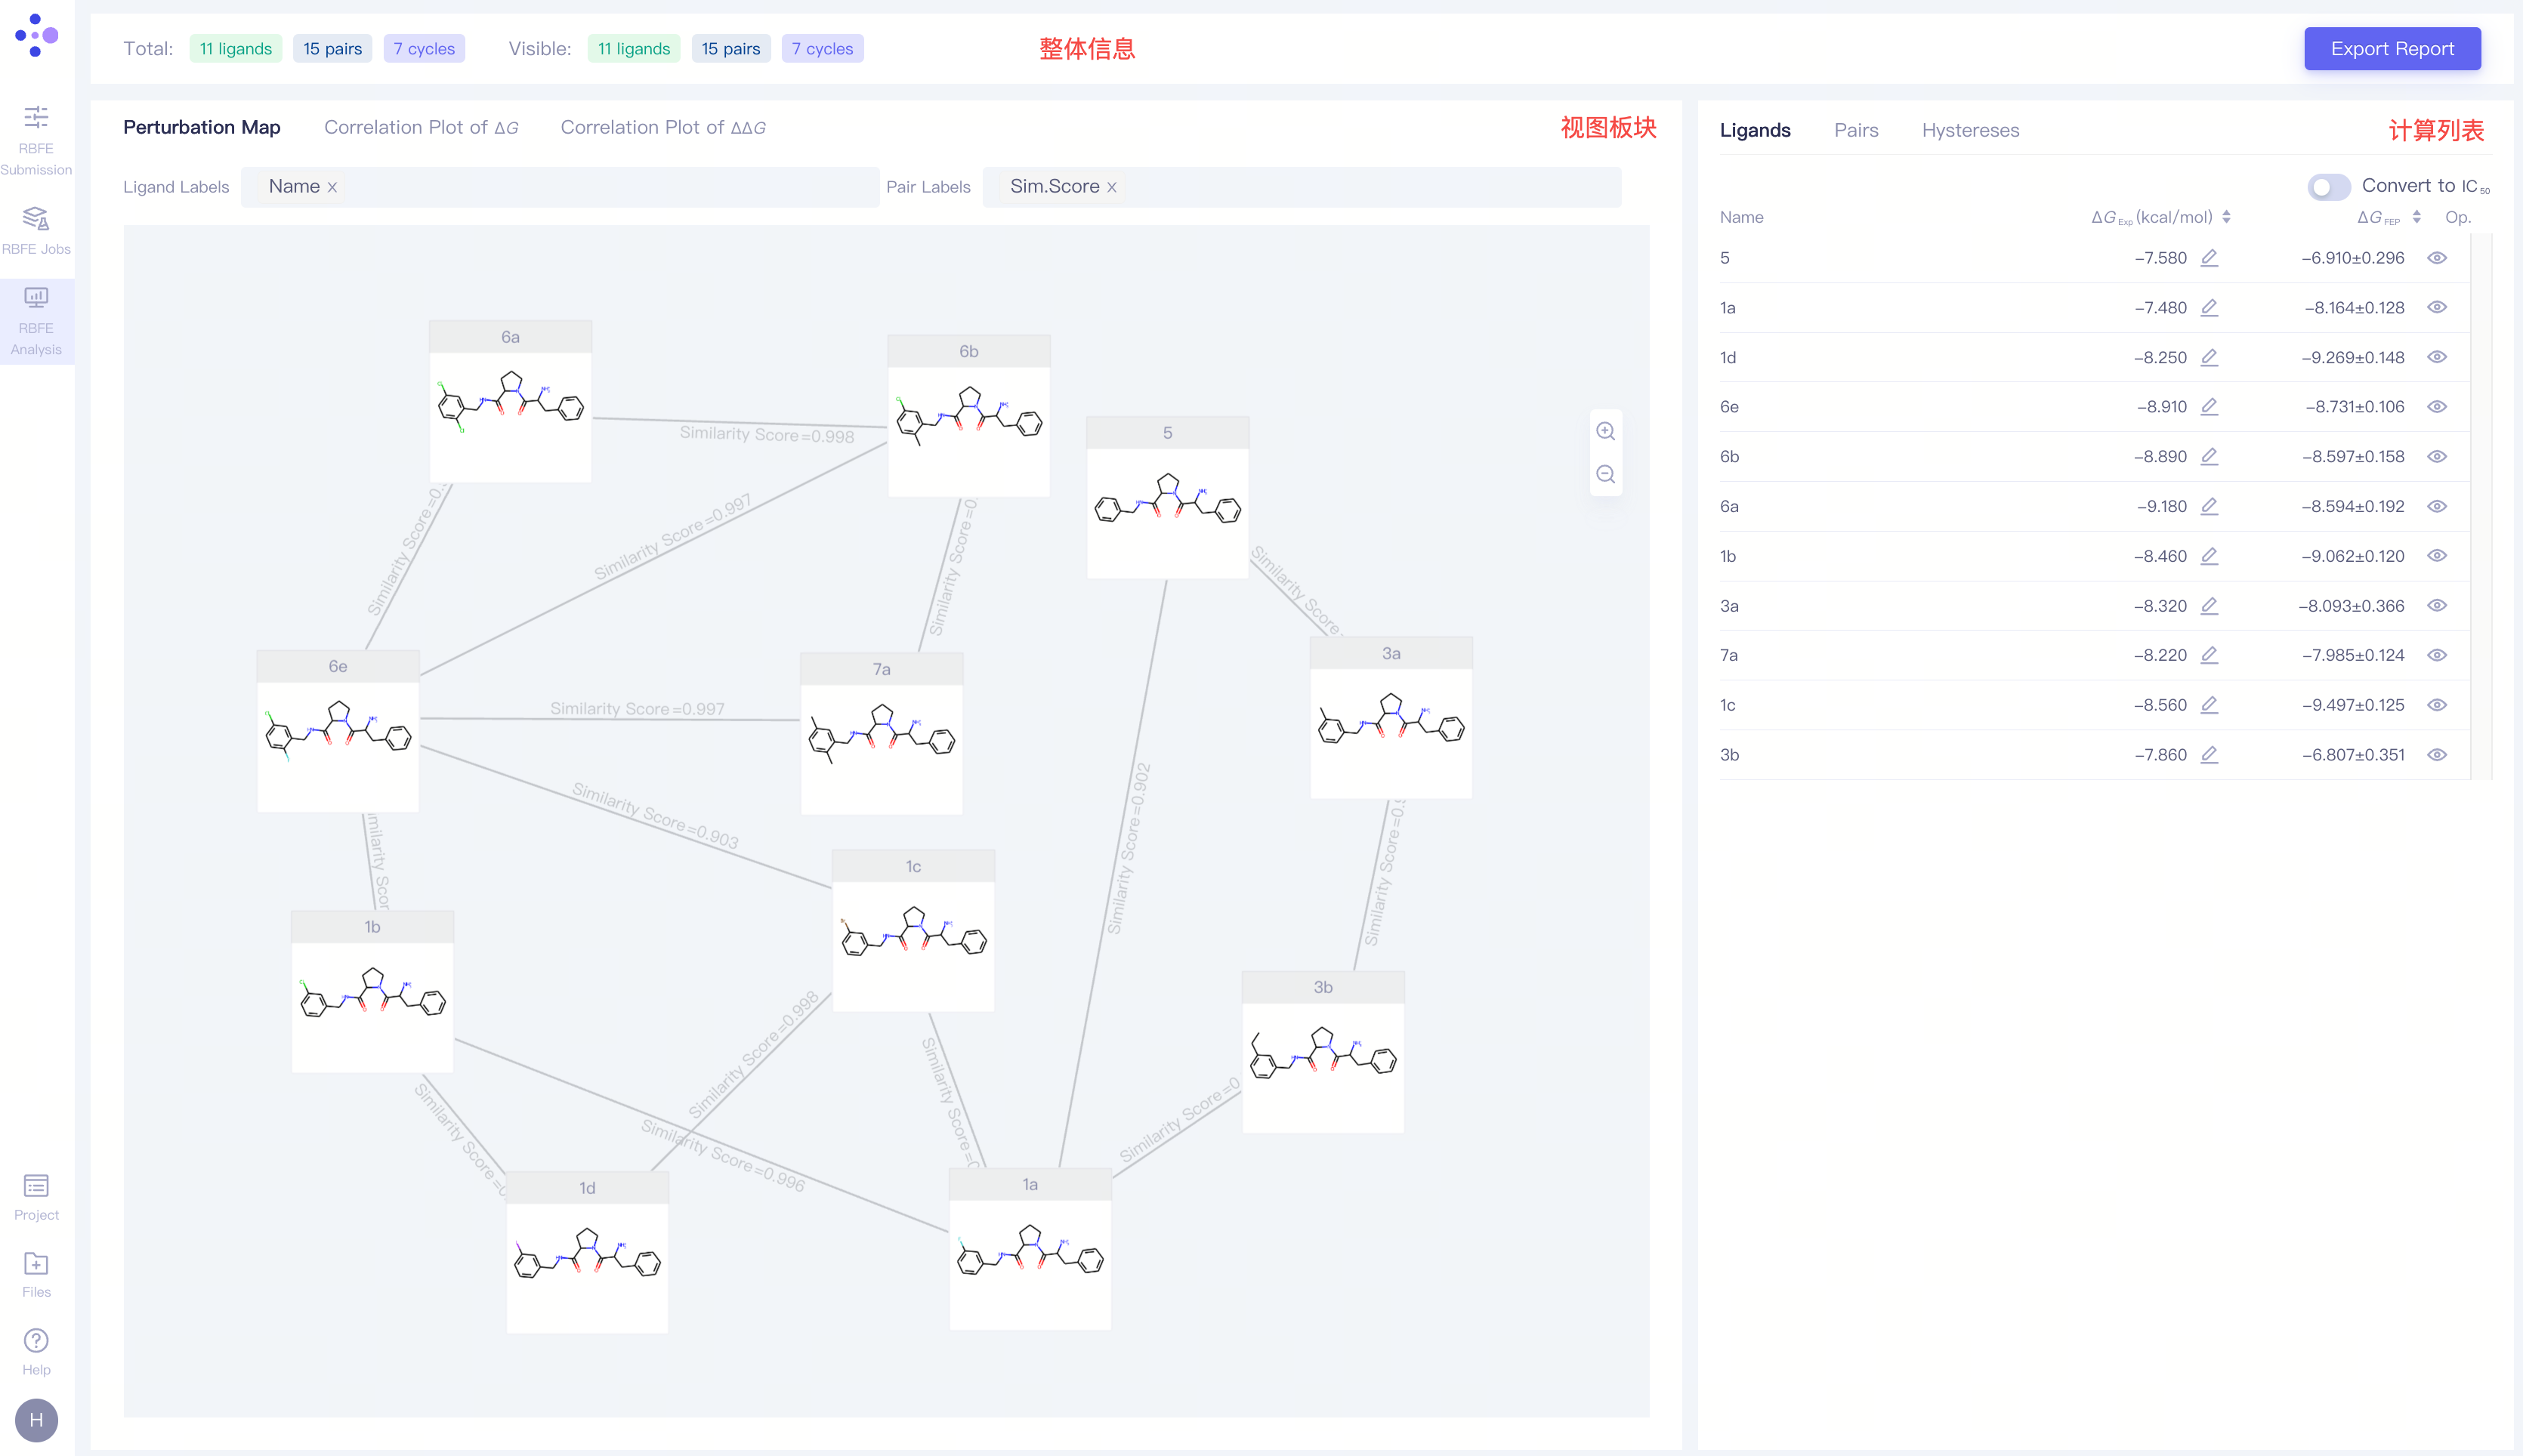
3.1 Project Overview
This section shows the number of pairs, ligands and hystereses in the project, as well as the number of currently displaying ligands, pairs and cycles. The Export Report button on the right side can export the result as well as the summary of this project.
3.2 View Interface
| View | Description | Example | Operations / Settings | Description |
| Perturbation Map | Displaying the perturbation map of the current project |
| Ligand Labels Pair Labels Zoom In Zoom Out | |
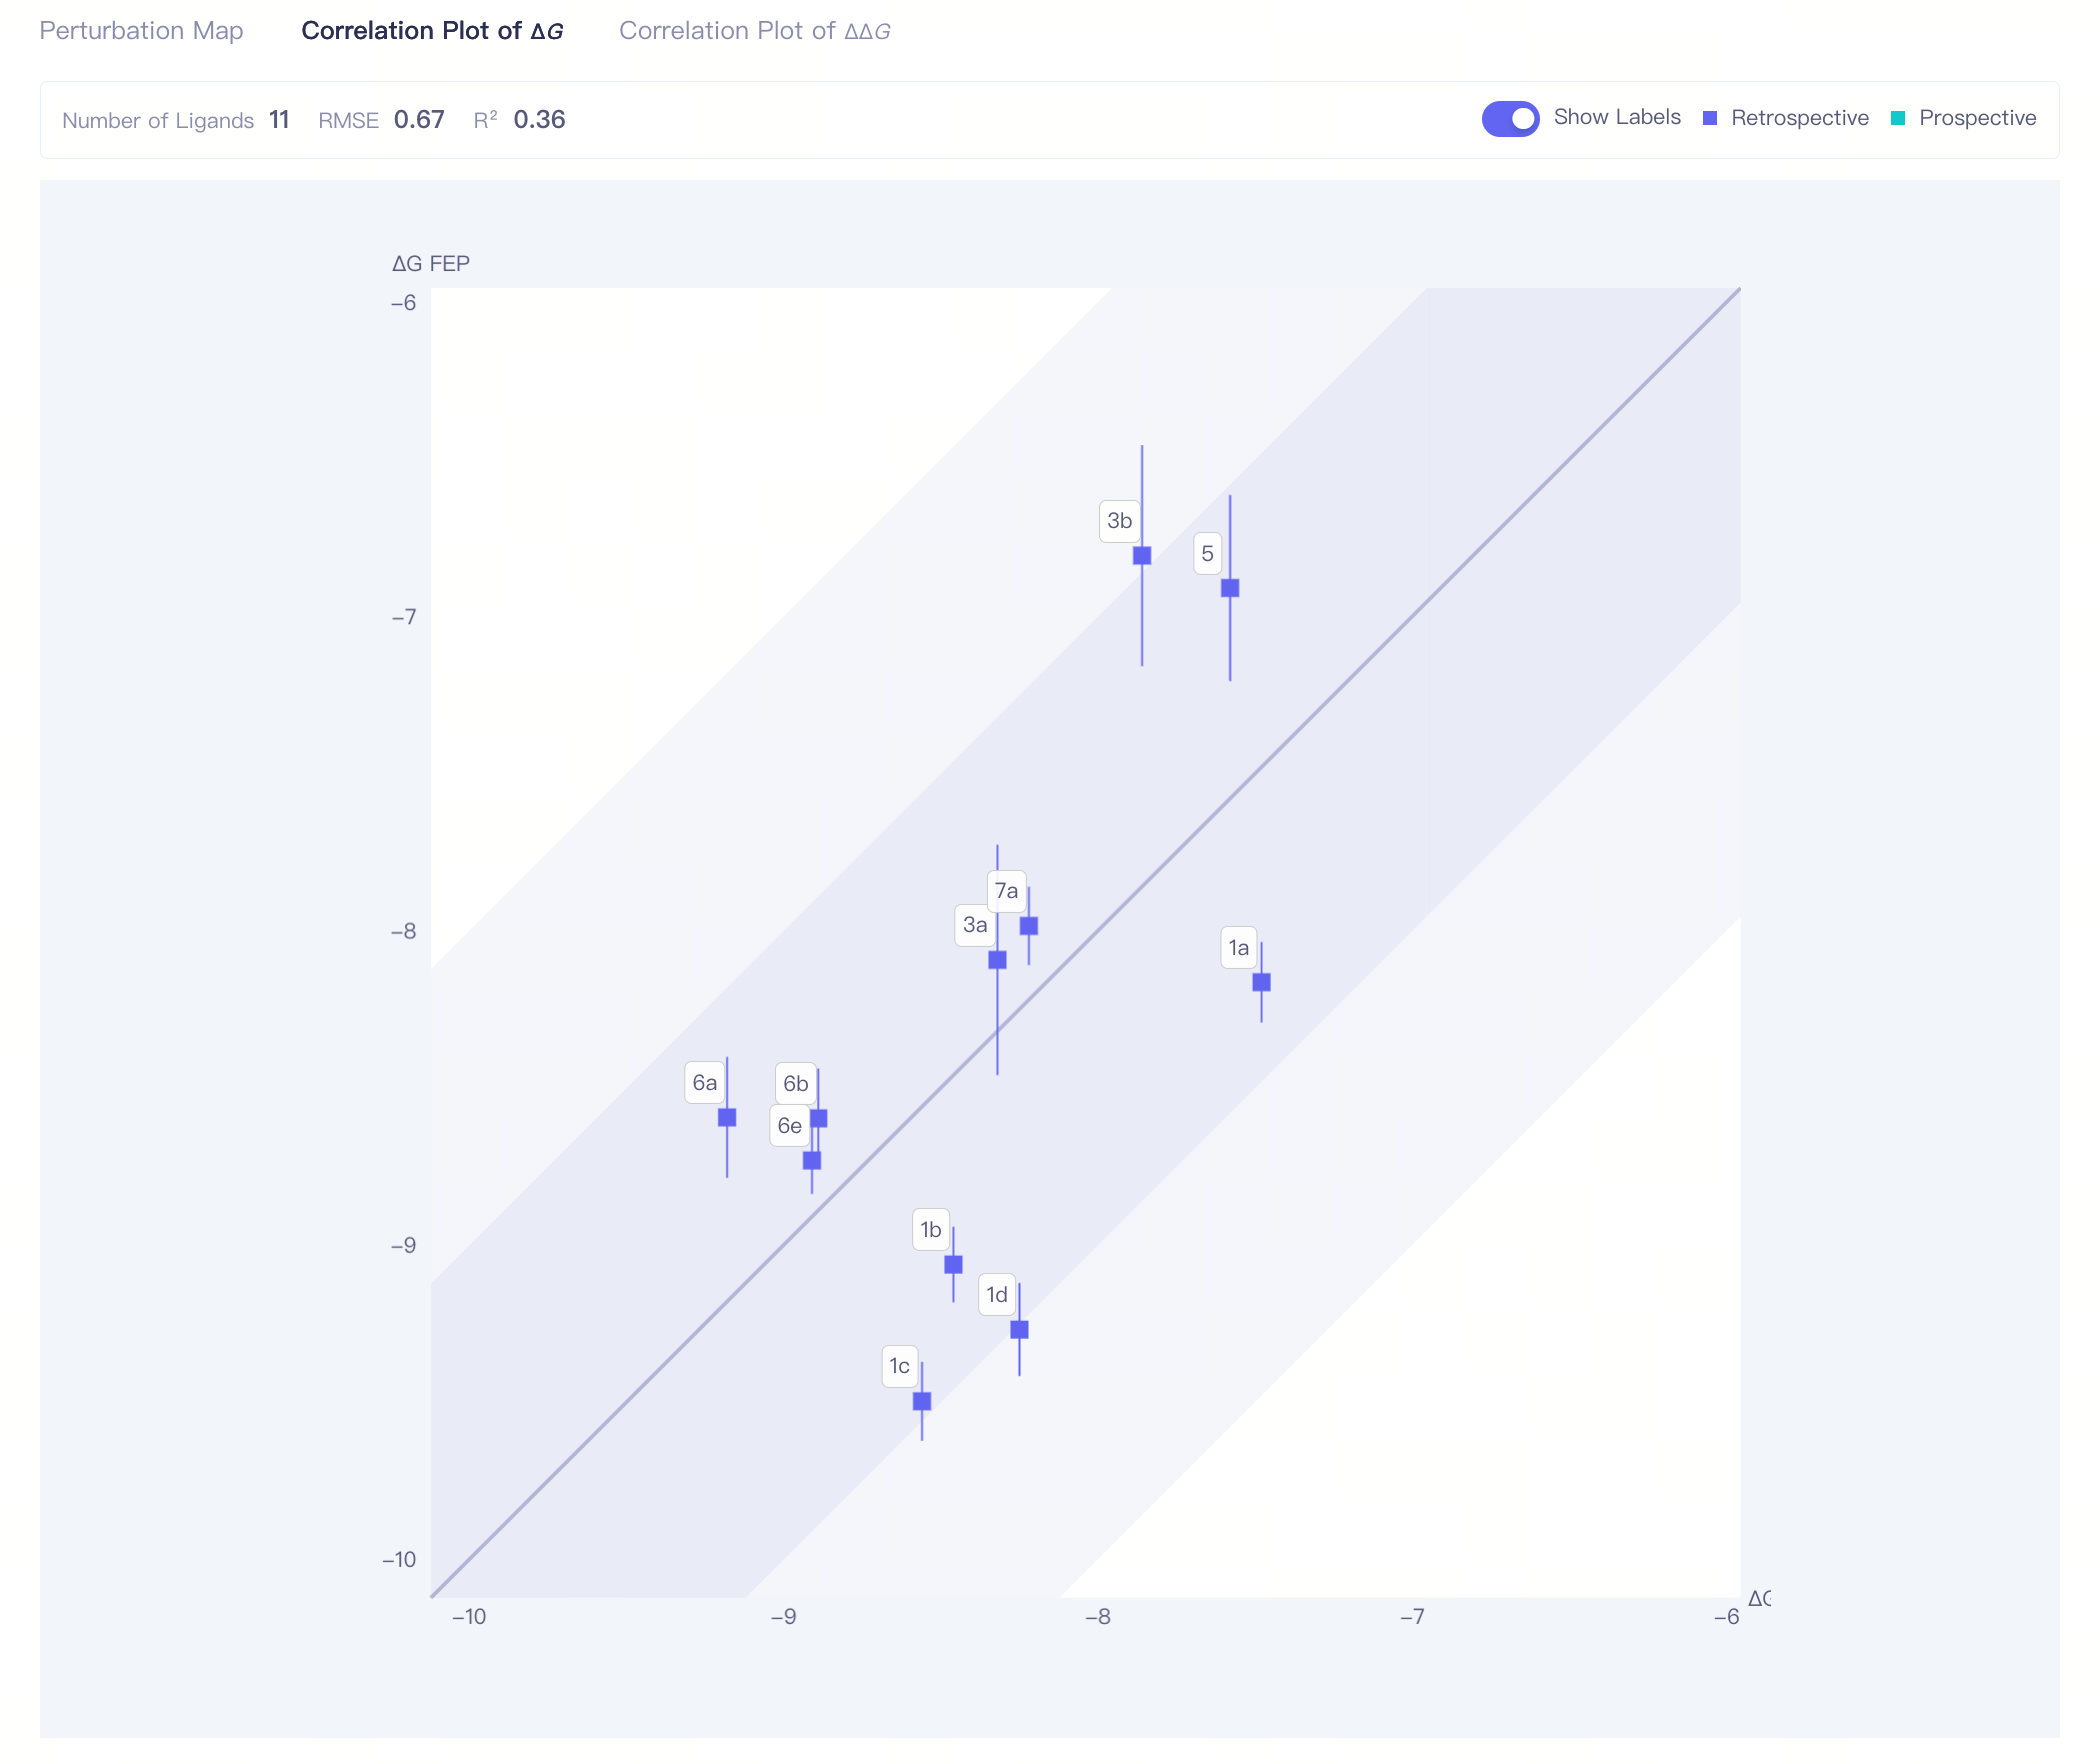
| Correlation Plot of ΔG | ΔG correlation plot:correlation analysis of the calculation result of all ligands. The dark region indicates an error range of <1 kcal/mol; the shallow region indicates an error range of <2 kcal/mol |
| RMSE | Root mean square error, computed through:
|
| R2 | Correlation coefficient, computed through: When the span of the molecule's experimental activity values is large, it is recommended to refer to the R² value. The closer R² is to 1, the more accurate the calculation results are, with R² > 0.4 being considered 'acceptable'. | |||
| Show Labels | Show ligands names of each point in the plot | |||
| Retrospective / Prospective | When experimental values are uploaded for a ligand, the correlation plot displays the correlation between FEP computed values and experimental values, represented by blue data points (Retrospective). When no experimental values are uploaded, the correlation plot only displays the correlation between FEP computed values and the molecule itself, represented by green data points (Prospective). | |||
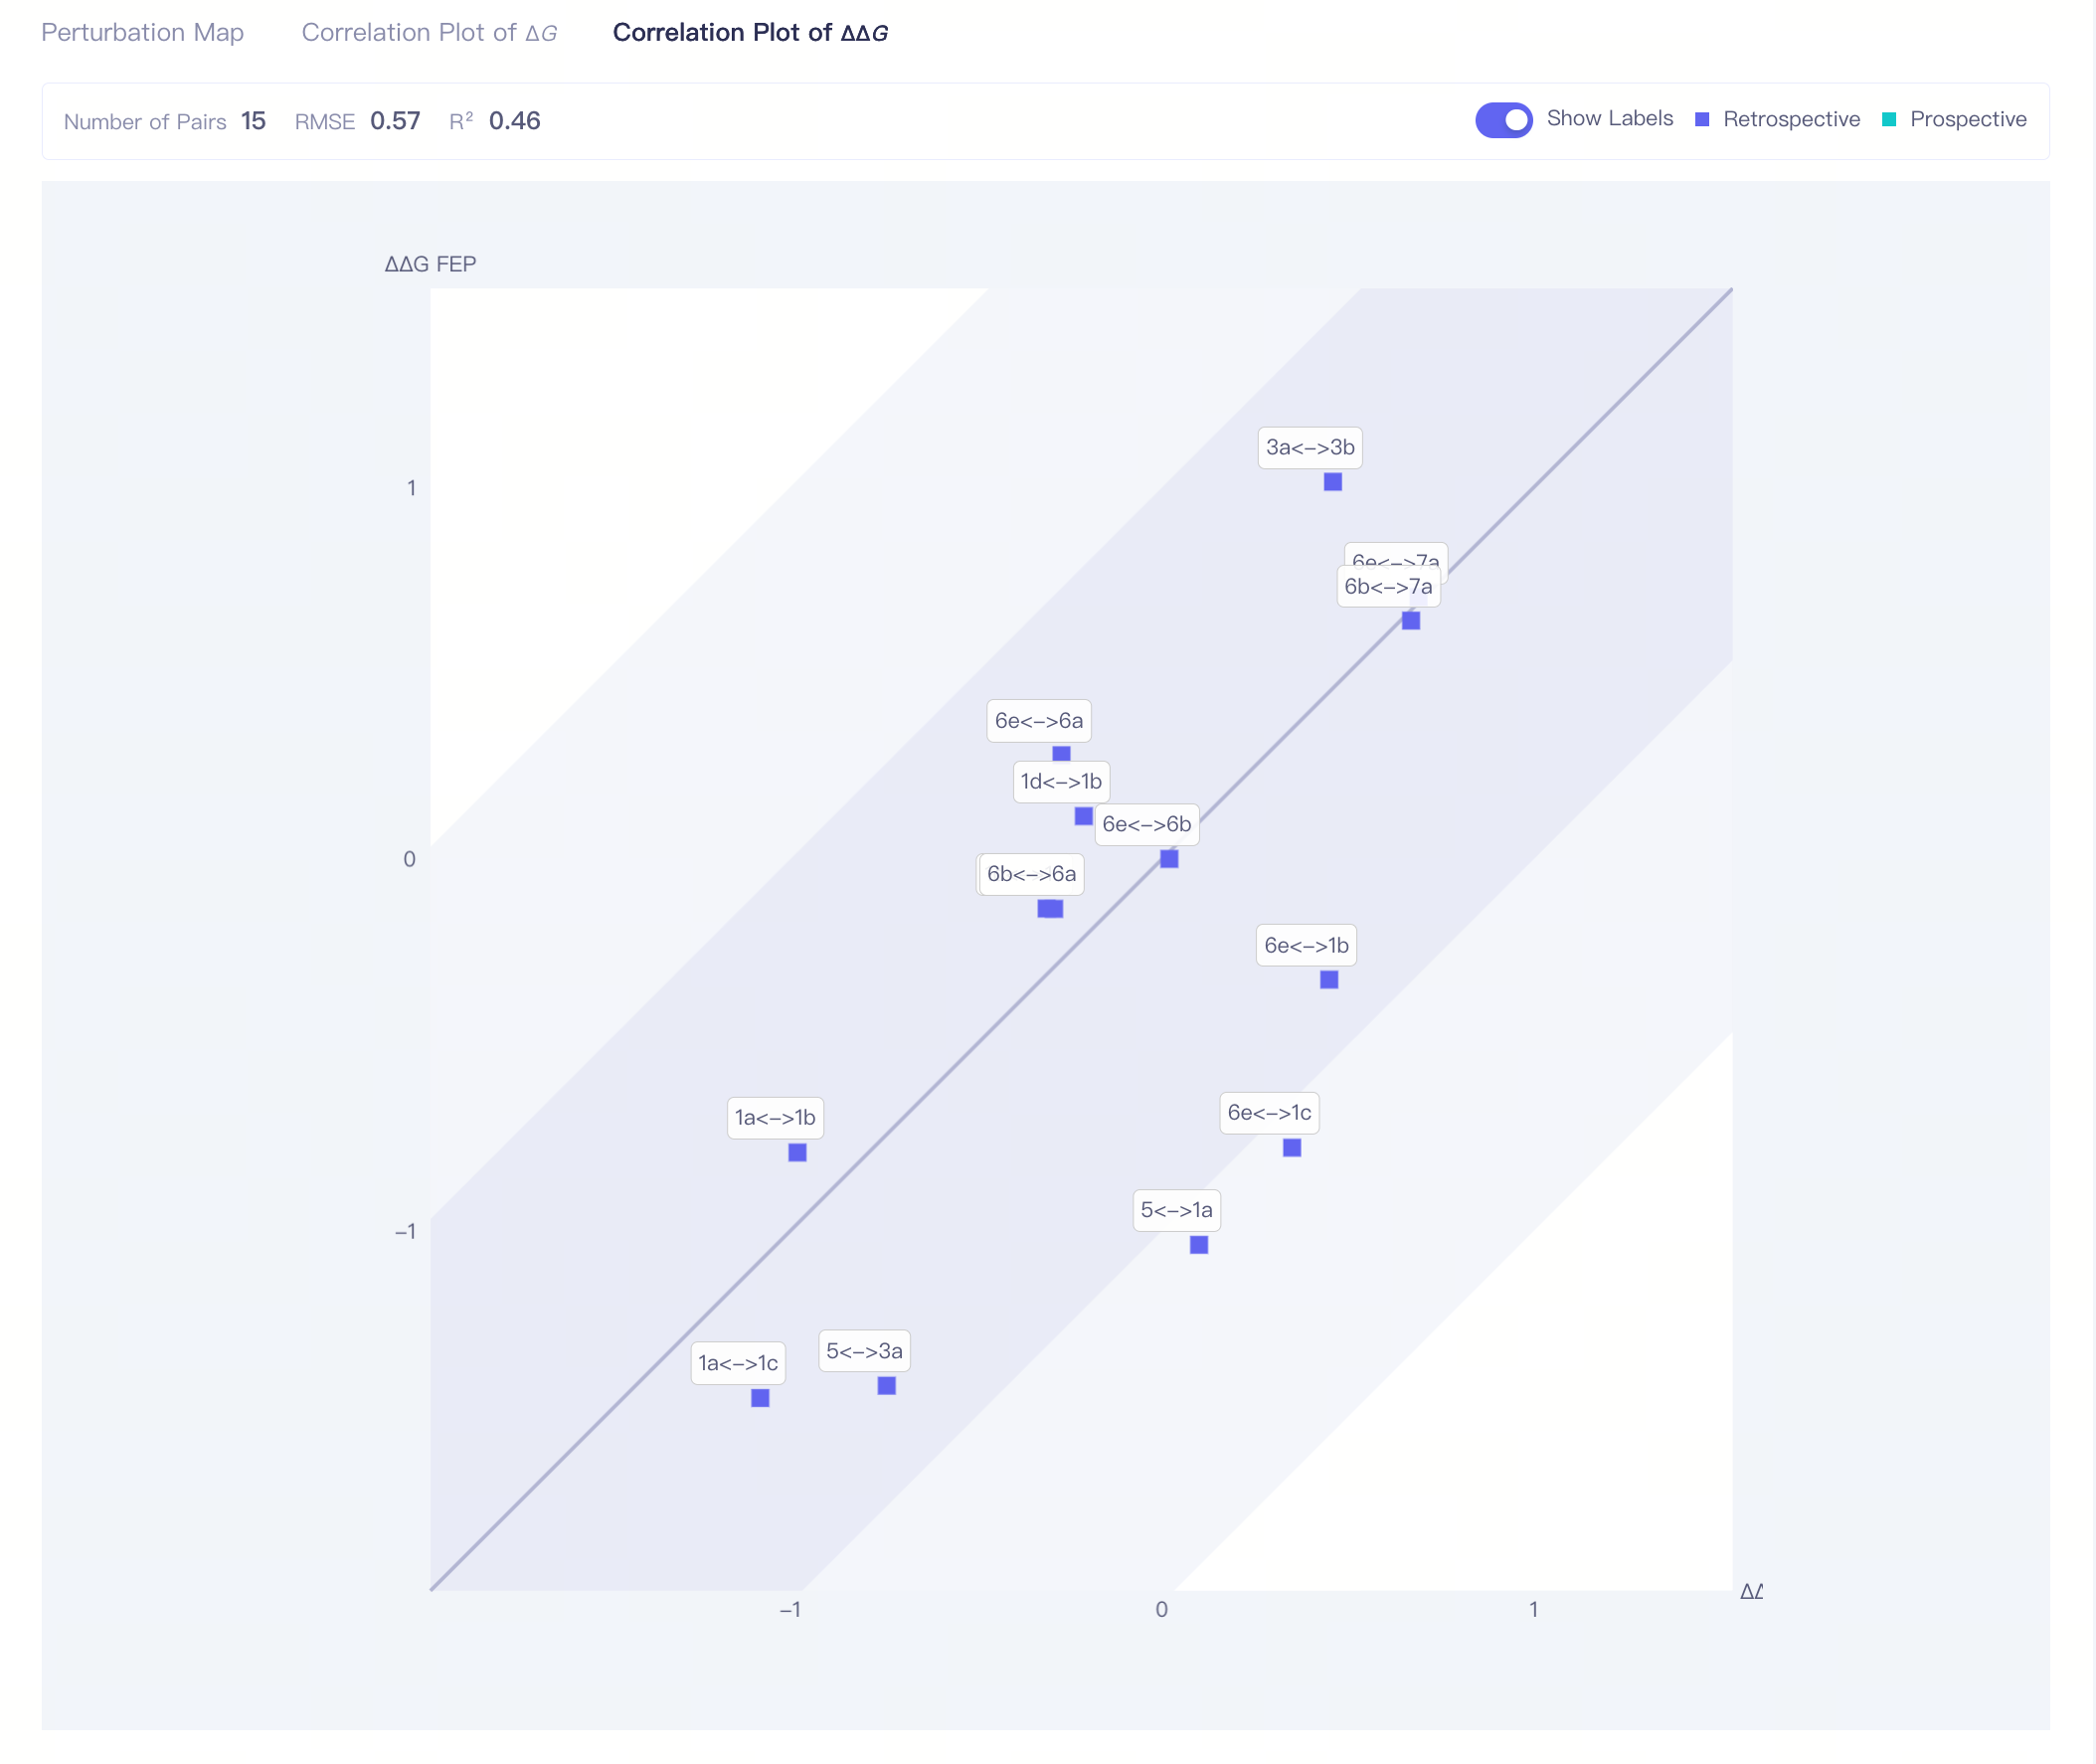
| Correlation Plot of ΔΔG | ΔΔG correlation plot:correlation analysis of the calculation result of all molecule pairs The dark region indicates an error range of <1 kcal/mol; the shallow region indicates an error range of <2 kcal/mol. |
| RMSE | Root mean square error, computed through the same equation as the RMSE above. RMSE < 1.0 kcal/mol is considered an acceptable value for accurate FEP calculation |
| R2| Correlation Coefficient | —— | |||
| Show Labels | Show ligands names of each pair in the plot |
3.3 Job List
| Item | Example | Sub-items | Description |
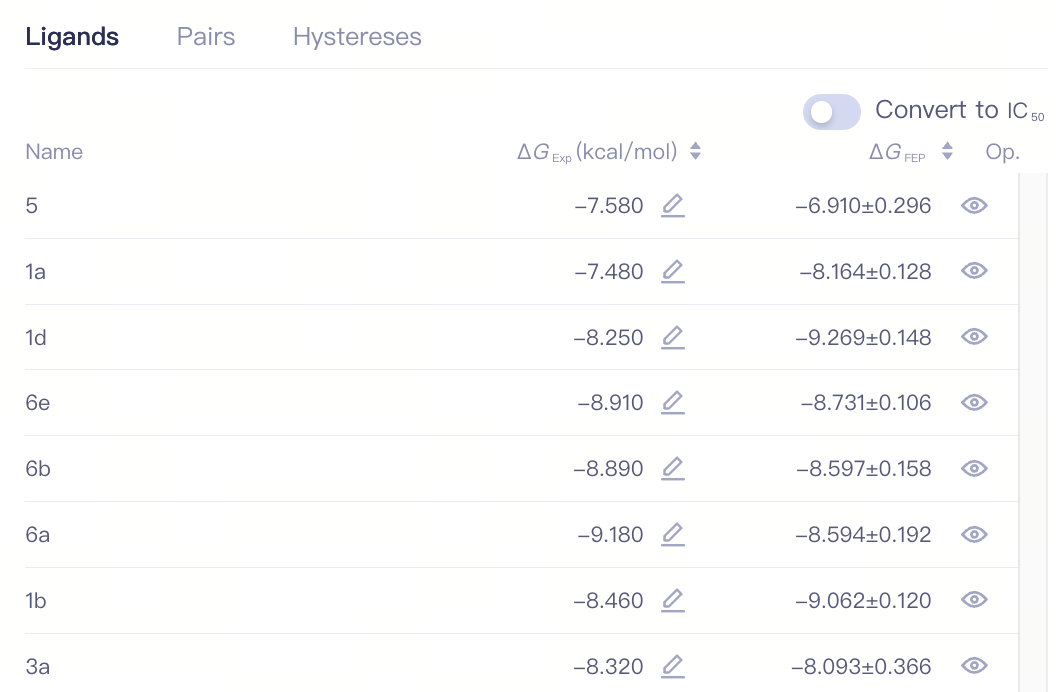
| Ligands |
| Convert to IC(50) | Convert to IC(50) |
| Name | Ligand Name | ||
| ΔG_Exp (kcal/mol) | Experimentally measured binding free energy of the ligand | ||
| ΔG_FEP | FEP calculated binding free energy of the ligand | ||
| Op. | Show/Hide show/hide this ligand | ||
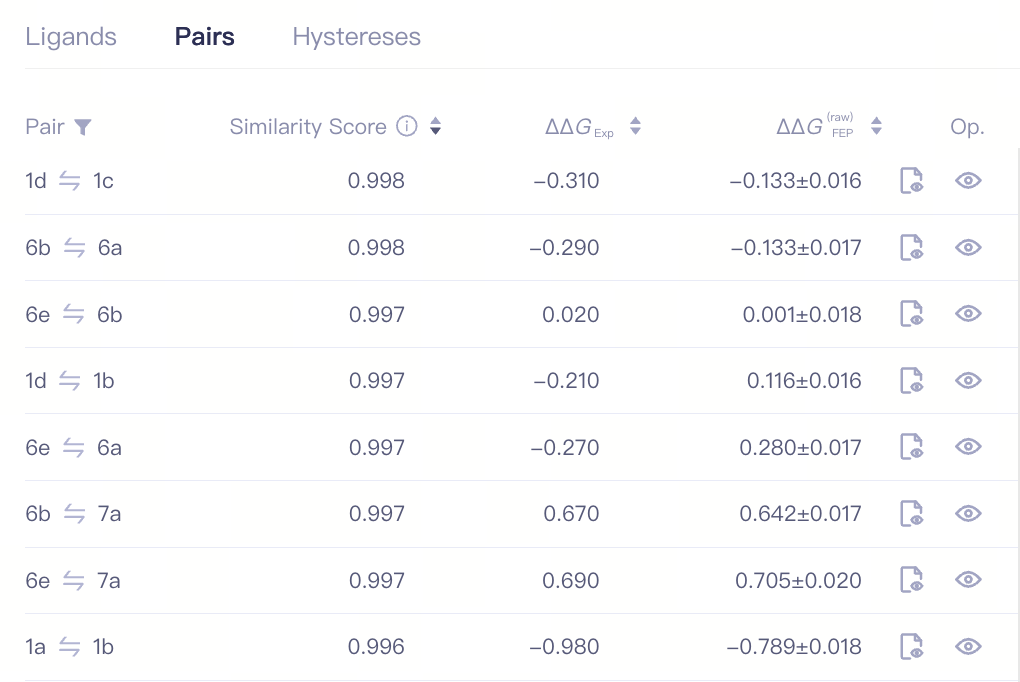
| Pairs |
| Pair | Paid Name |
| Similarity Score | Similarity Score | ||
| ΔΔG_Exp | The difference in experimental measured binding free energy values between the two ligands in a pair. | ||
| ΔΔG_FEP(raw) | The difference in FEP calculated binding free energy values between the two ligands in a pair. | ||
| Op. | Mapping Display atom mapping | ||
| Show/Hide Show / hide this pair | |||
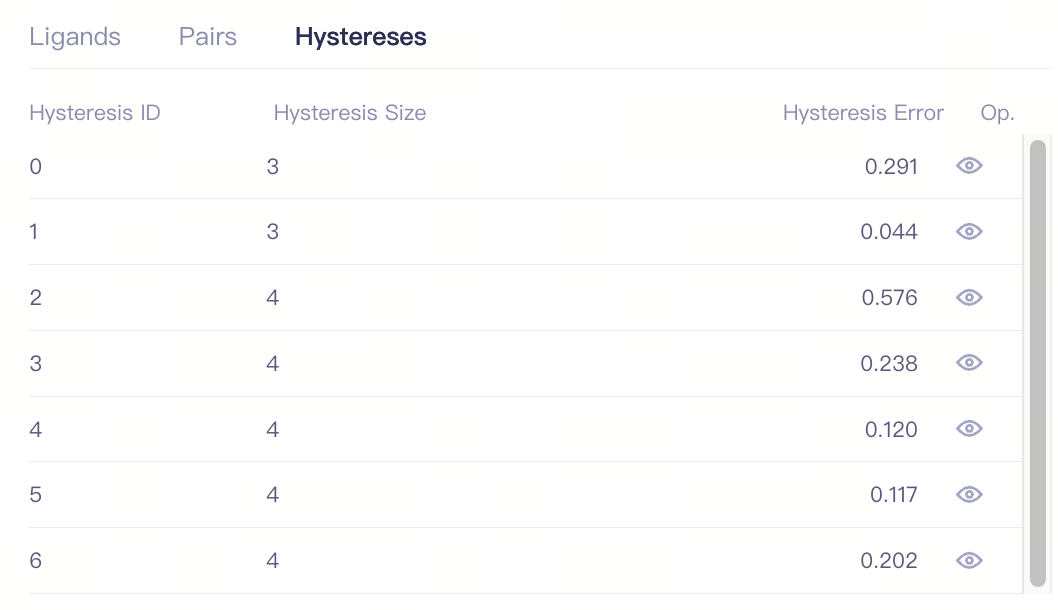
| Hystereses |
| Hysteresis ID | Hysteresis ID |
| Hysteresis Size | Size of the hysteresis | ||
| Hysteresis Error | The hysteresisc cycle error reflects the calculation error of the thermodynamic loop. Ideally, this error should approach 0. Generally, when the Hysteresis Error is < 0.8, the thermodynamic cycle can be considered reliable. | ||
| Op. | Show/Hide Show / hide this hysteresis |
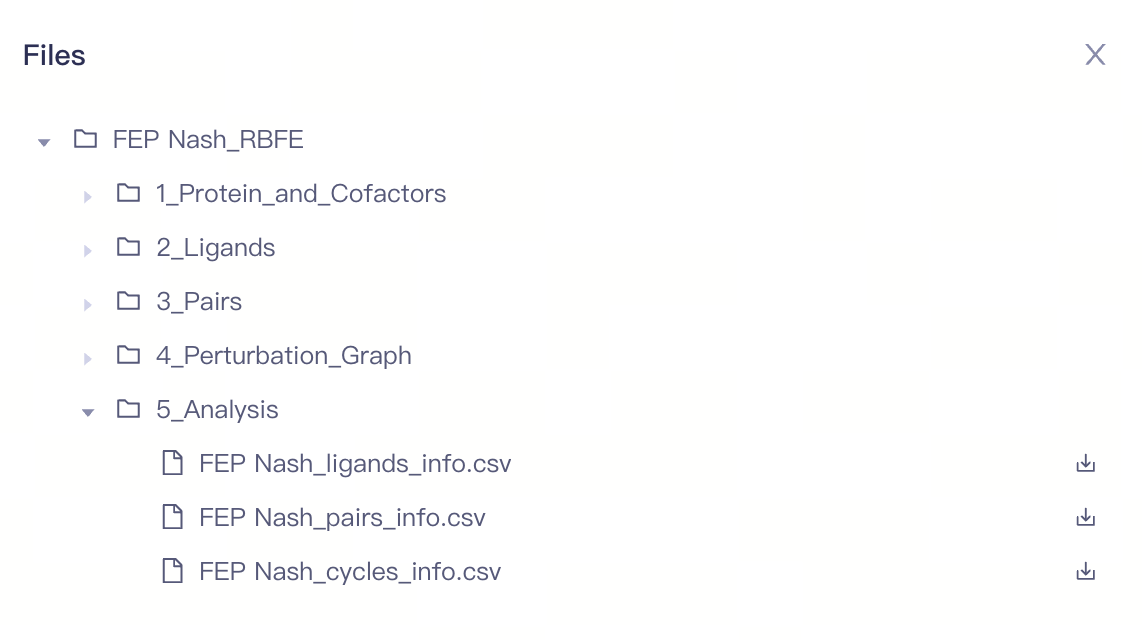
4. Files
The file center records the input files and the result files of each FEP calculation.
1_Protein_and_Cofactors: Supports downloading initial protein file([protein name].pdb), the protein protonation form (protein_protonation_states.csv), non-standard factor files. If the protein has been embedded in the membrance, then [protein name]_with_membrane.pdb will also be included.
2_Ligands: Supports downloading ligand files([ligand name].sdf) and uploading ligand binding affinity files(FEP Nash_exp_affinity.csv)
3_Pairs: Supports downloading calculation files of different batches of simulations (Simulation_n), including job informaiotn ([pair name]_simulation0_info.csv), log infomation ([pair name]_simulation0_log.txt), simulation report ([pair name]_simulation0_report.pdf), Mapping information ([pair name]simulation0_3D_atom_mapping.csv), trajectory file (Trajectory[ligand name]).
4_Perturbation_Graph: Support downloading the perturbation graph form (protein_perturbation_graph.csv)
5_Analysis: Support downloading the calculation result file of molecules (FEP Nash_ligands_info.csv), the calculation result file of molecule pairs (FEP Nash_pairs_info.csv), the hysteresis info file (FEP Nash_cycles_info.csv).